| Audience | Marketers and analysts who want to compare performance across randomized test and control groups. |
| Prerequisites |
|
Experiments help you evaluate how different marketing strategies perform by analyzing outcomes across randomized experiment groups. You can measure lift, compare treatment and holdout results, and understand whether your campaigns drive meaningful changes in user behavior.
What you'll learn
After reading this article, you’ll know how to:
- Identify how Experiments are created and managed
- Set up Audience Experiments for measurement
- Navigate to and review all Experiments
- Configure metrics, start dates, and measurement windows
- Interpret lift, confidence intervals, and performance trends
- Normalize results for clearer comparisons
Overview
Experiments provide a measurement layer for Audience Experiments.
Whenever you create an Audience Experiment in Customer Studio or configure an experiment on an A/B split node in Journeys, Hightouch automatically generates a corresponding Experiment so you can track performance across randomized groups.
Experiments allow you to:
- Compare holdout vs. treatment outcomes
- Analyze lift and confidence intervals
- Visualize performance over time
- Evaluate strategies continuously
| Feature | Description |
|---|---|
| Experiment results | Displays lift, performance trends, and confidence intervals |
| Configuration | Controls metrics, measurement windows, and start dates |
| Normalization | Enables per-member or baseline-scaled comparisons |
Experiment measurement charts have been updated. All experiment reporting now
lives in Intelligence → Experiments.
How Experiments are created
Experiments are automatically managed based on Audience Experiments in Customer Studio:
- Creating an Audience Experiment automatically creates a corresponding Experiment.
- Disabling or deleting an Audience Experiment removes its Experiment.
- Restoring an Audience Experiment restores its Experiment.
This ensures measurement stays aligned with the audiences you're actively using.
Setup and requirements
1. Create Audience Experiments
Before measuring experiment results:
- Create Audience Experiments in Customer Studio.
- Ensure the audience has synced at least once after the experiment groups were created.
- Confirm that users generate measurable events (such as purchases, page views, or clicks).
For every Audience Experiment created in Customer Studio, Hightouch
automatically creates a corresponding Experiment in Intelligence →
Experiments. Deleting or restoring an Audience Experiment removes or
restores the linked Experiment.
Measure results
The Experiments section of Intelligence helps you compare outcomes between experiment groups and evaluate the impact of your campaigns.
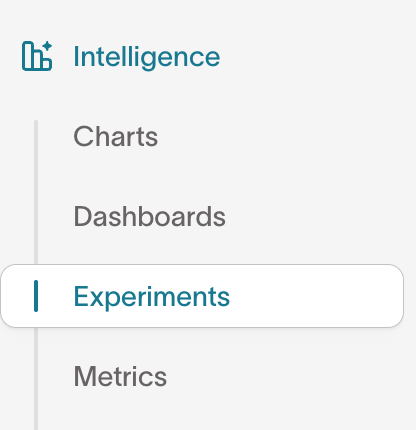
Navigate to: Intelligence → Experiments
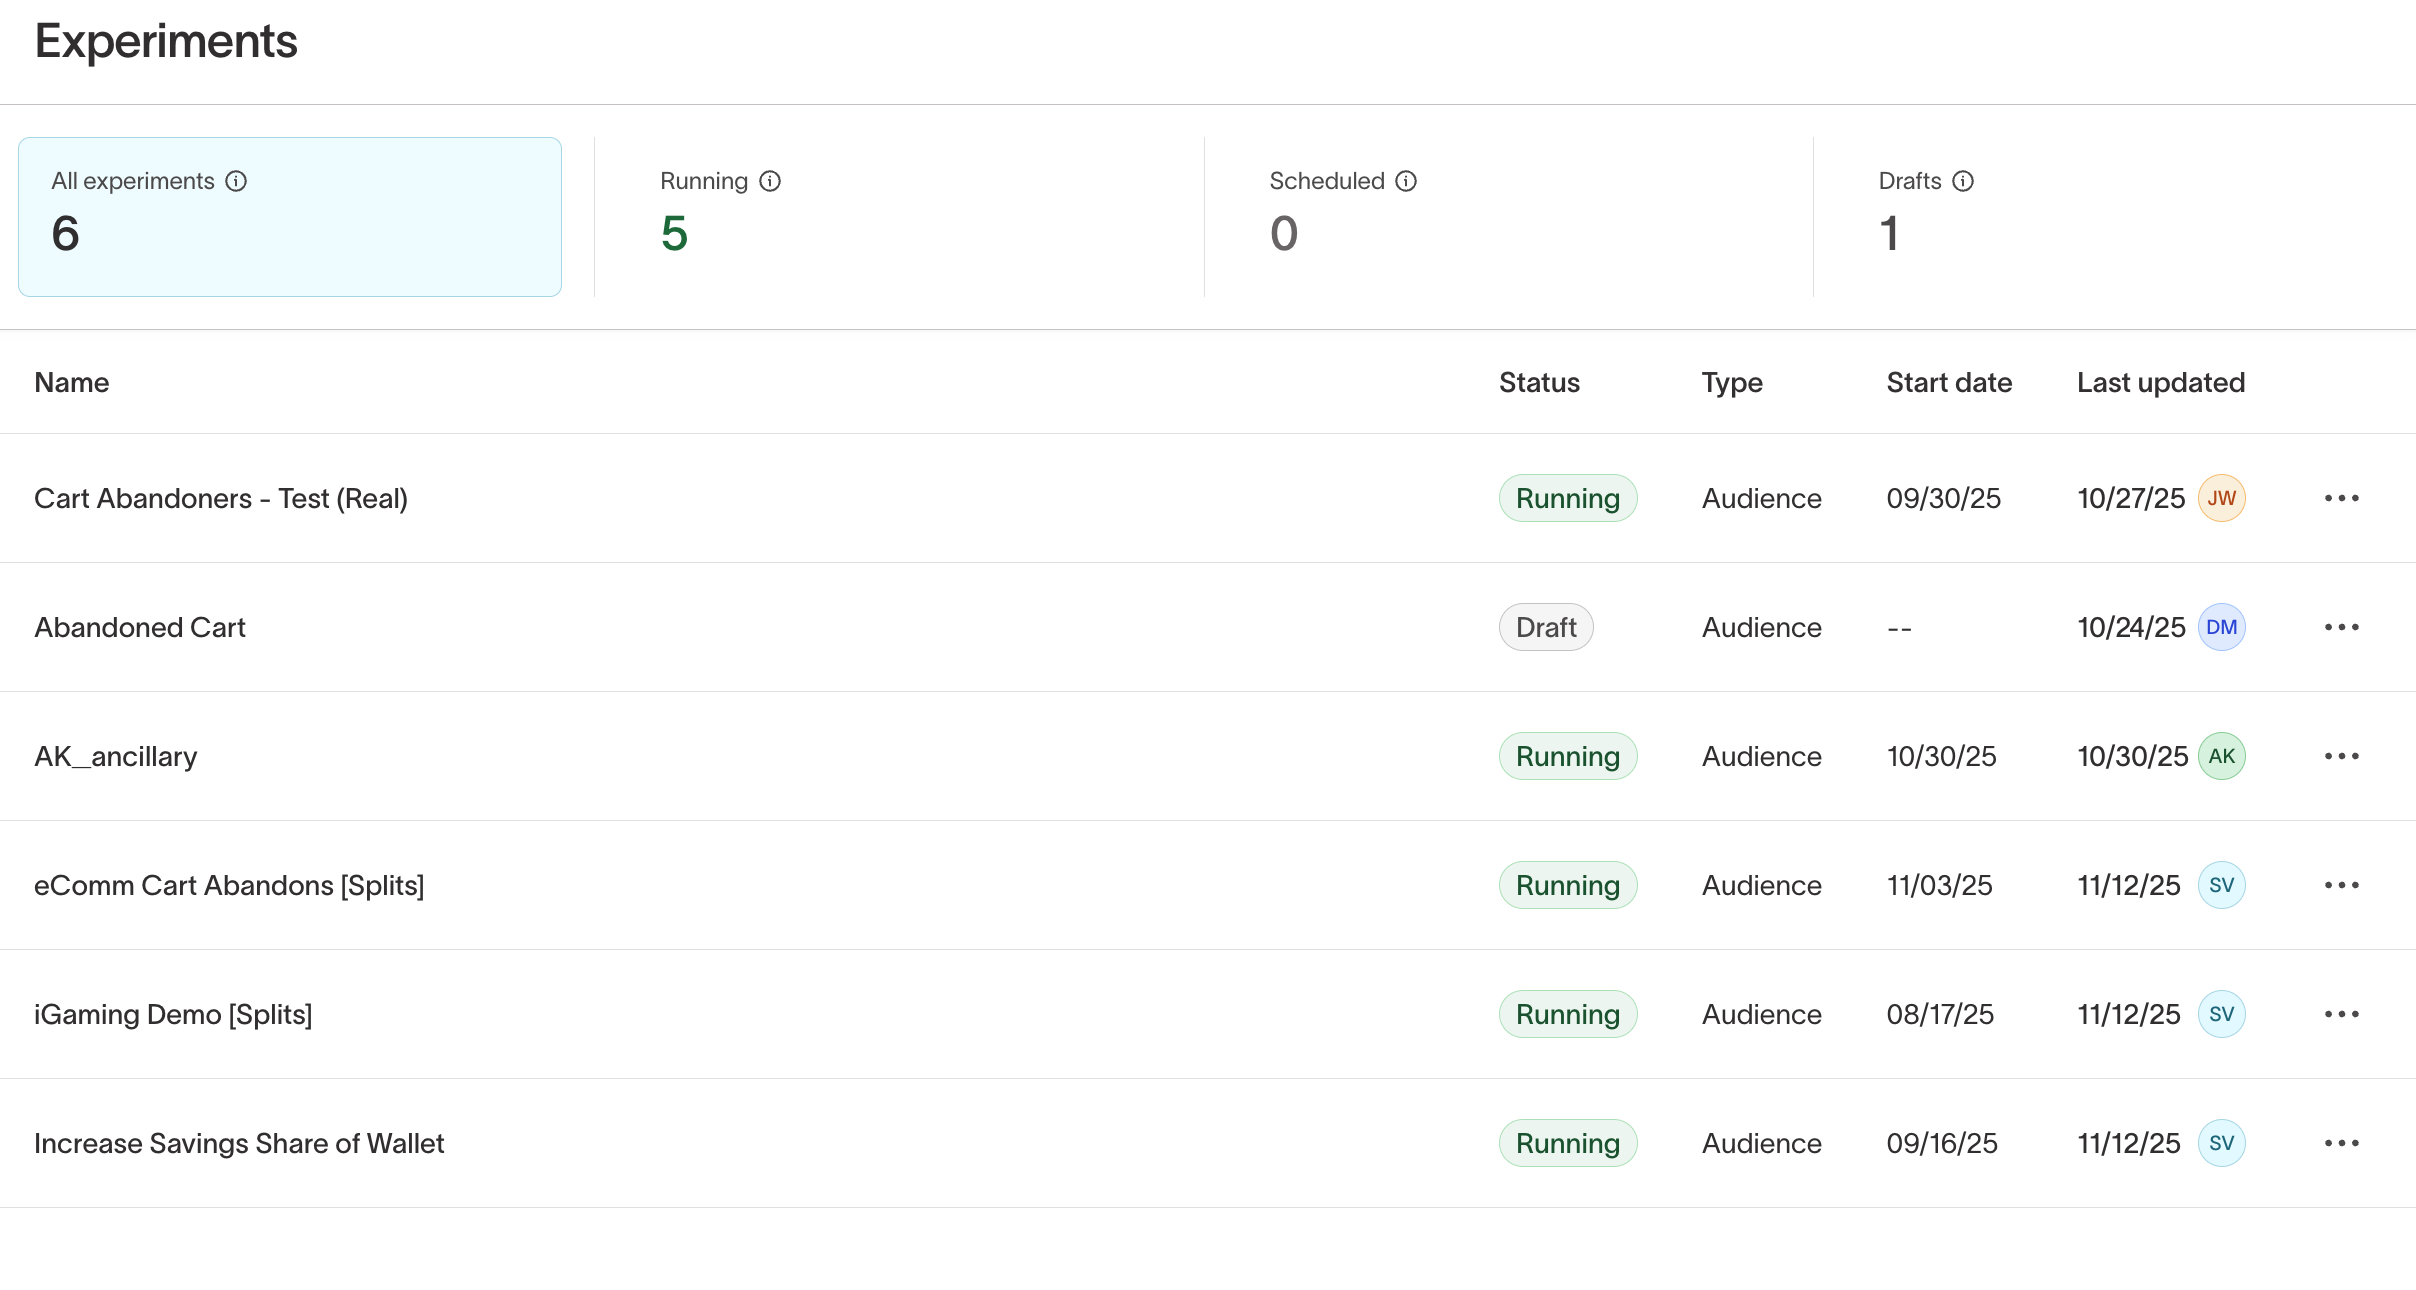
1. View list of Experiments
The Experiments list shows all Experiments, their statuses, and recent updates.
Statuses include:
- Draft: Missing one or both required configuration elements (primary metric or start date).
- Scheduled: Fully configured; the start date is in the future.
- Running: Fully configured; the start date is today or in the past.
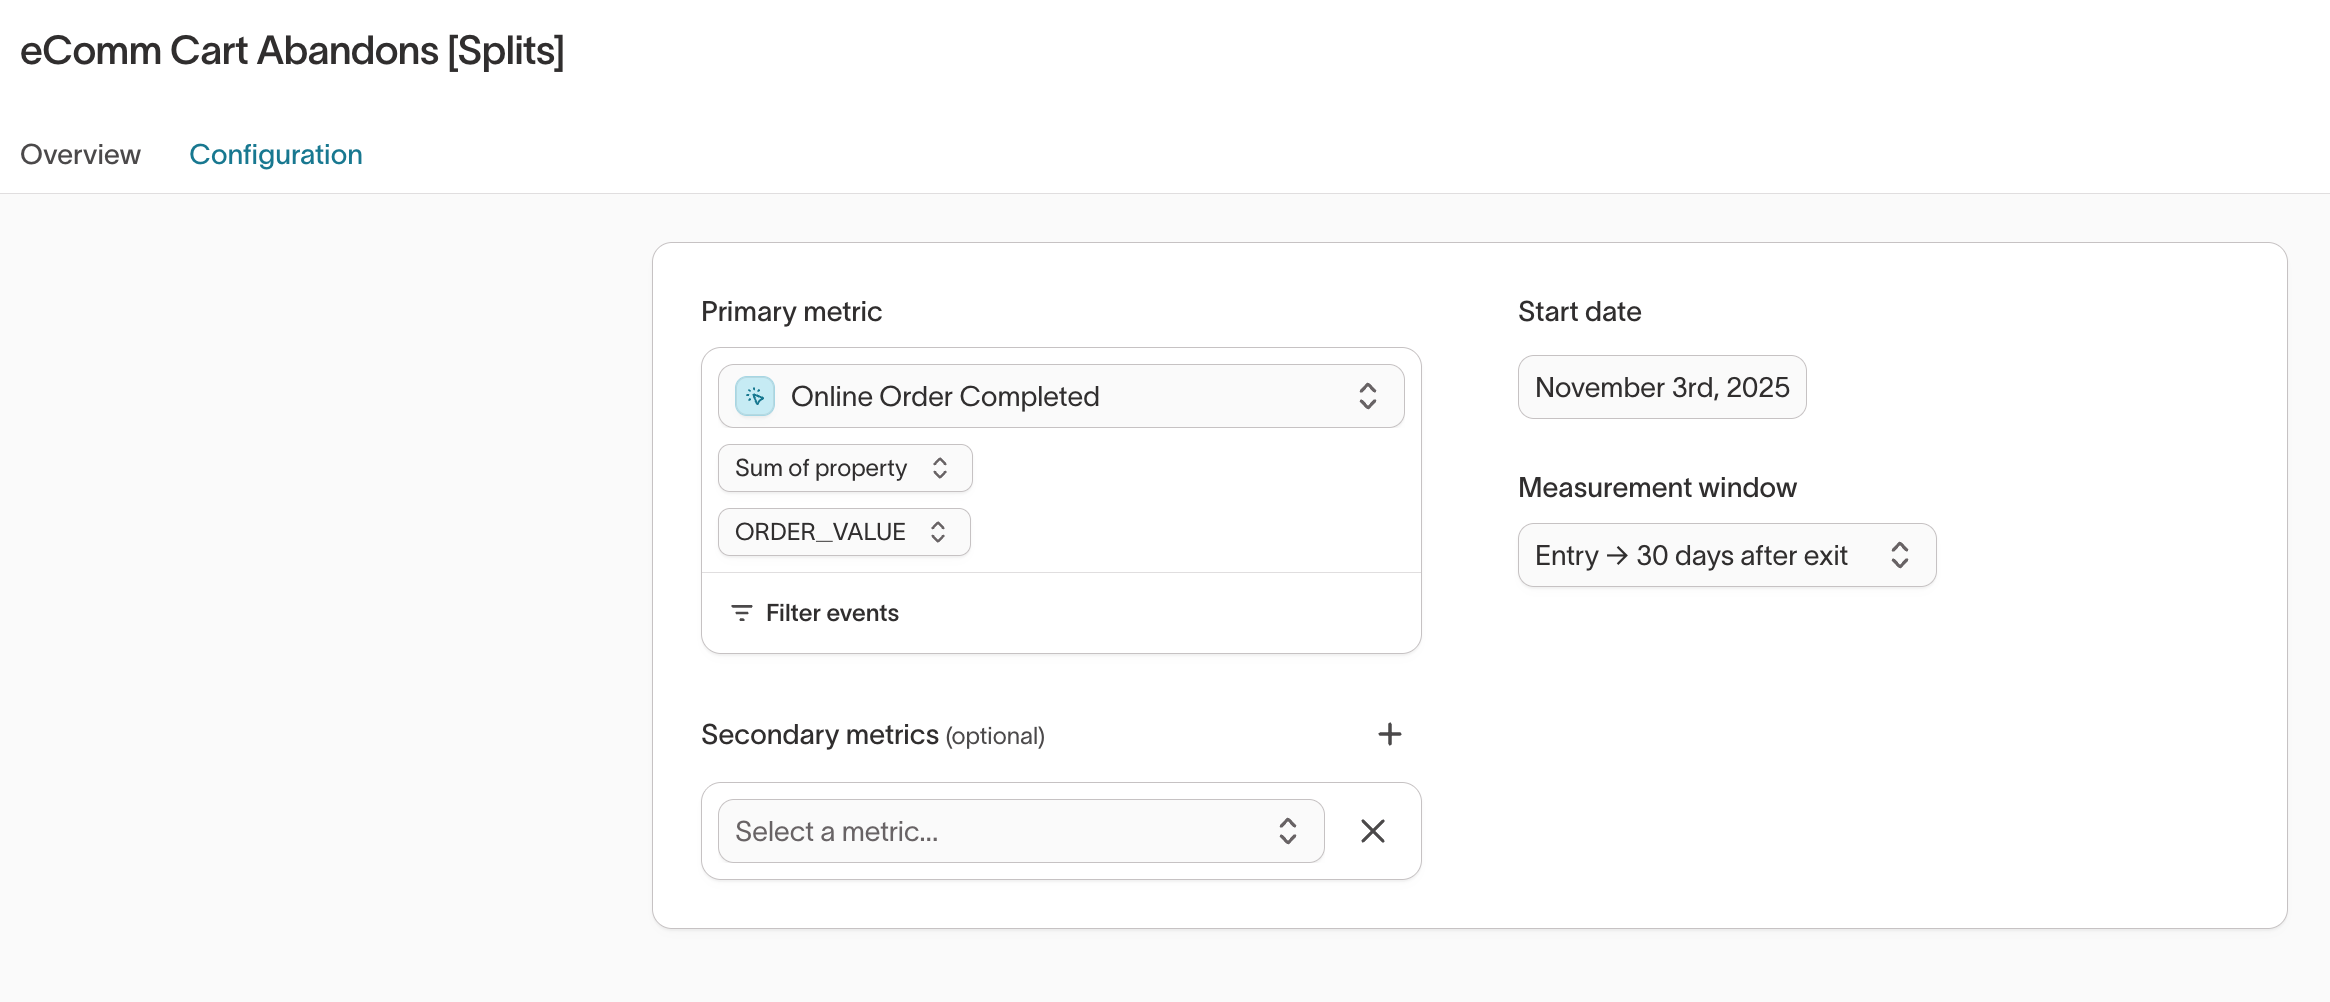
2. Configure an experiment
Open an experiment and select the Configuration tab.
From here, you can:
- Choose a primary metric (required) and optional secondary metrics (e.g., Conversions, Revenue).
- Learn how to create a metric.
- Optional: Use the
Filter bydropdown to refine by user properties or events.
- Set a Start date
- Determines when measurement begins.
- Does not apply retroactively.
- Does not affect sync or activation behavior.
- Choose a Measurement window
- Example: Entry → 30 days after entry measures events from the moment the user enters the audience to 30 days later.
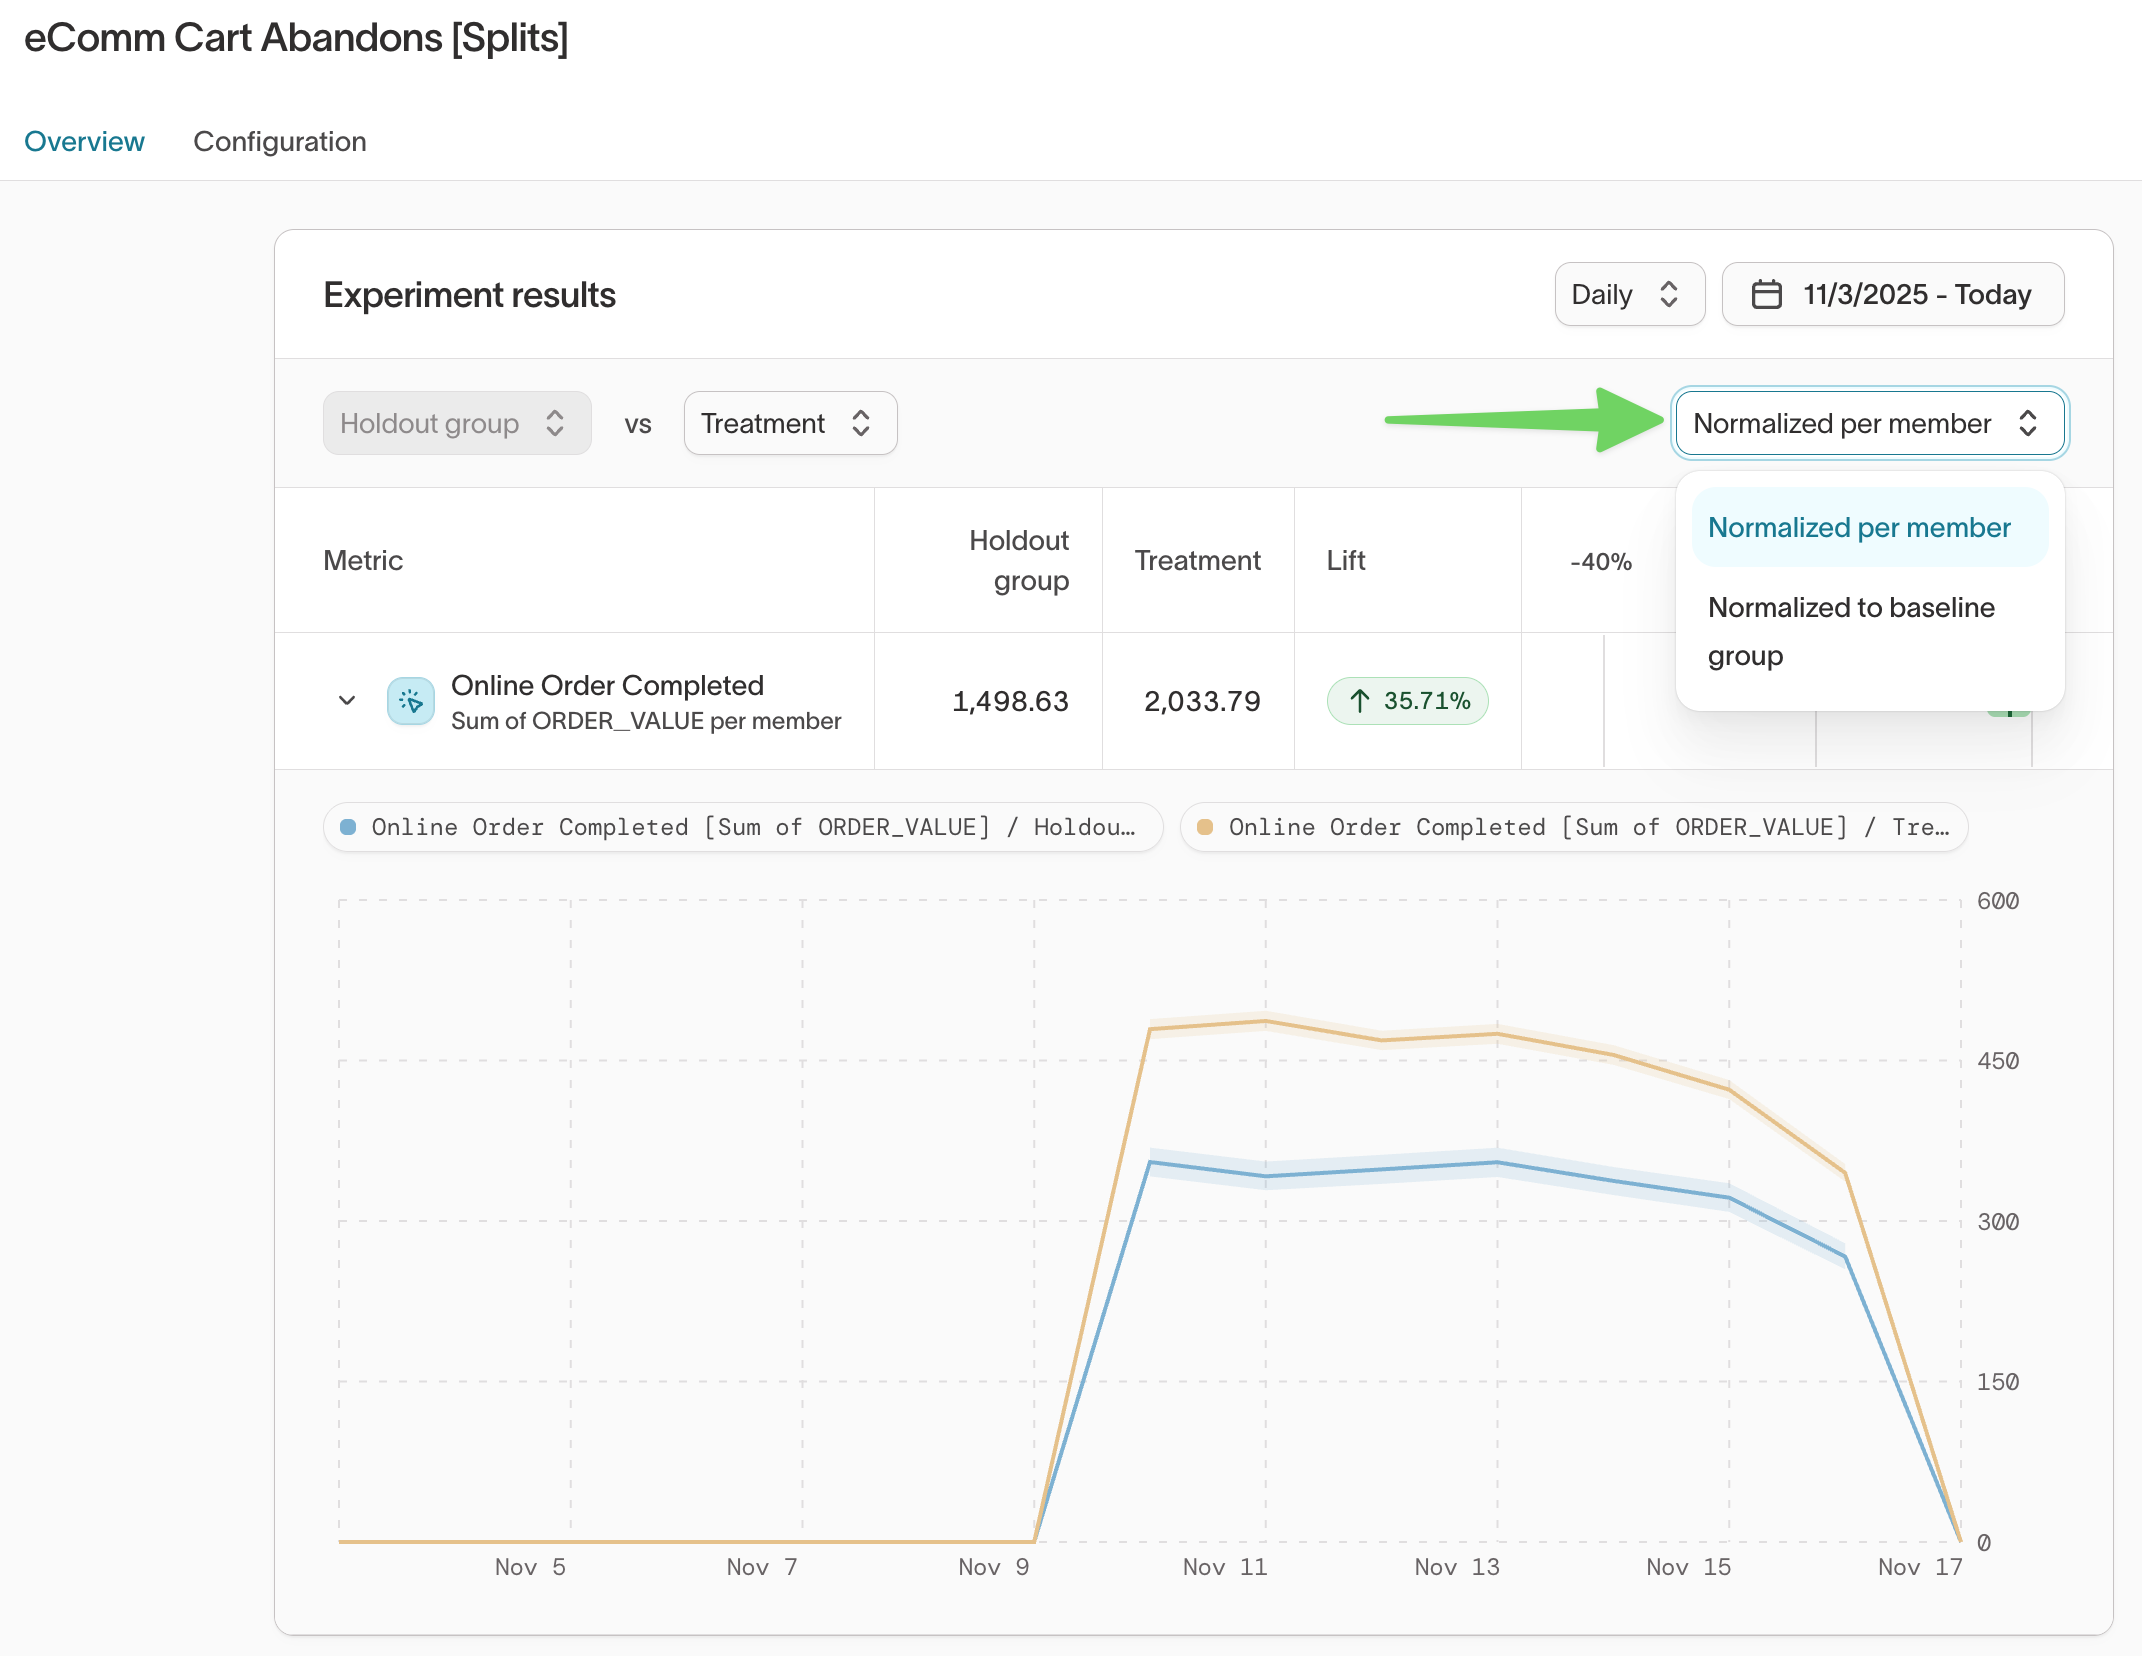
3. Interpret results
The Overview tab displays experiment outcomes and performance trends.
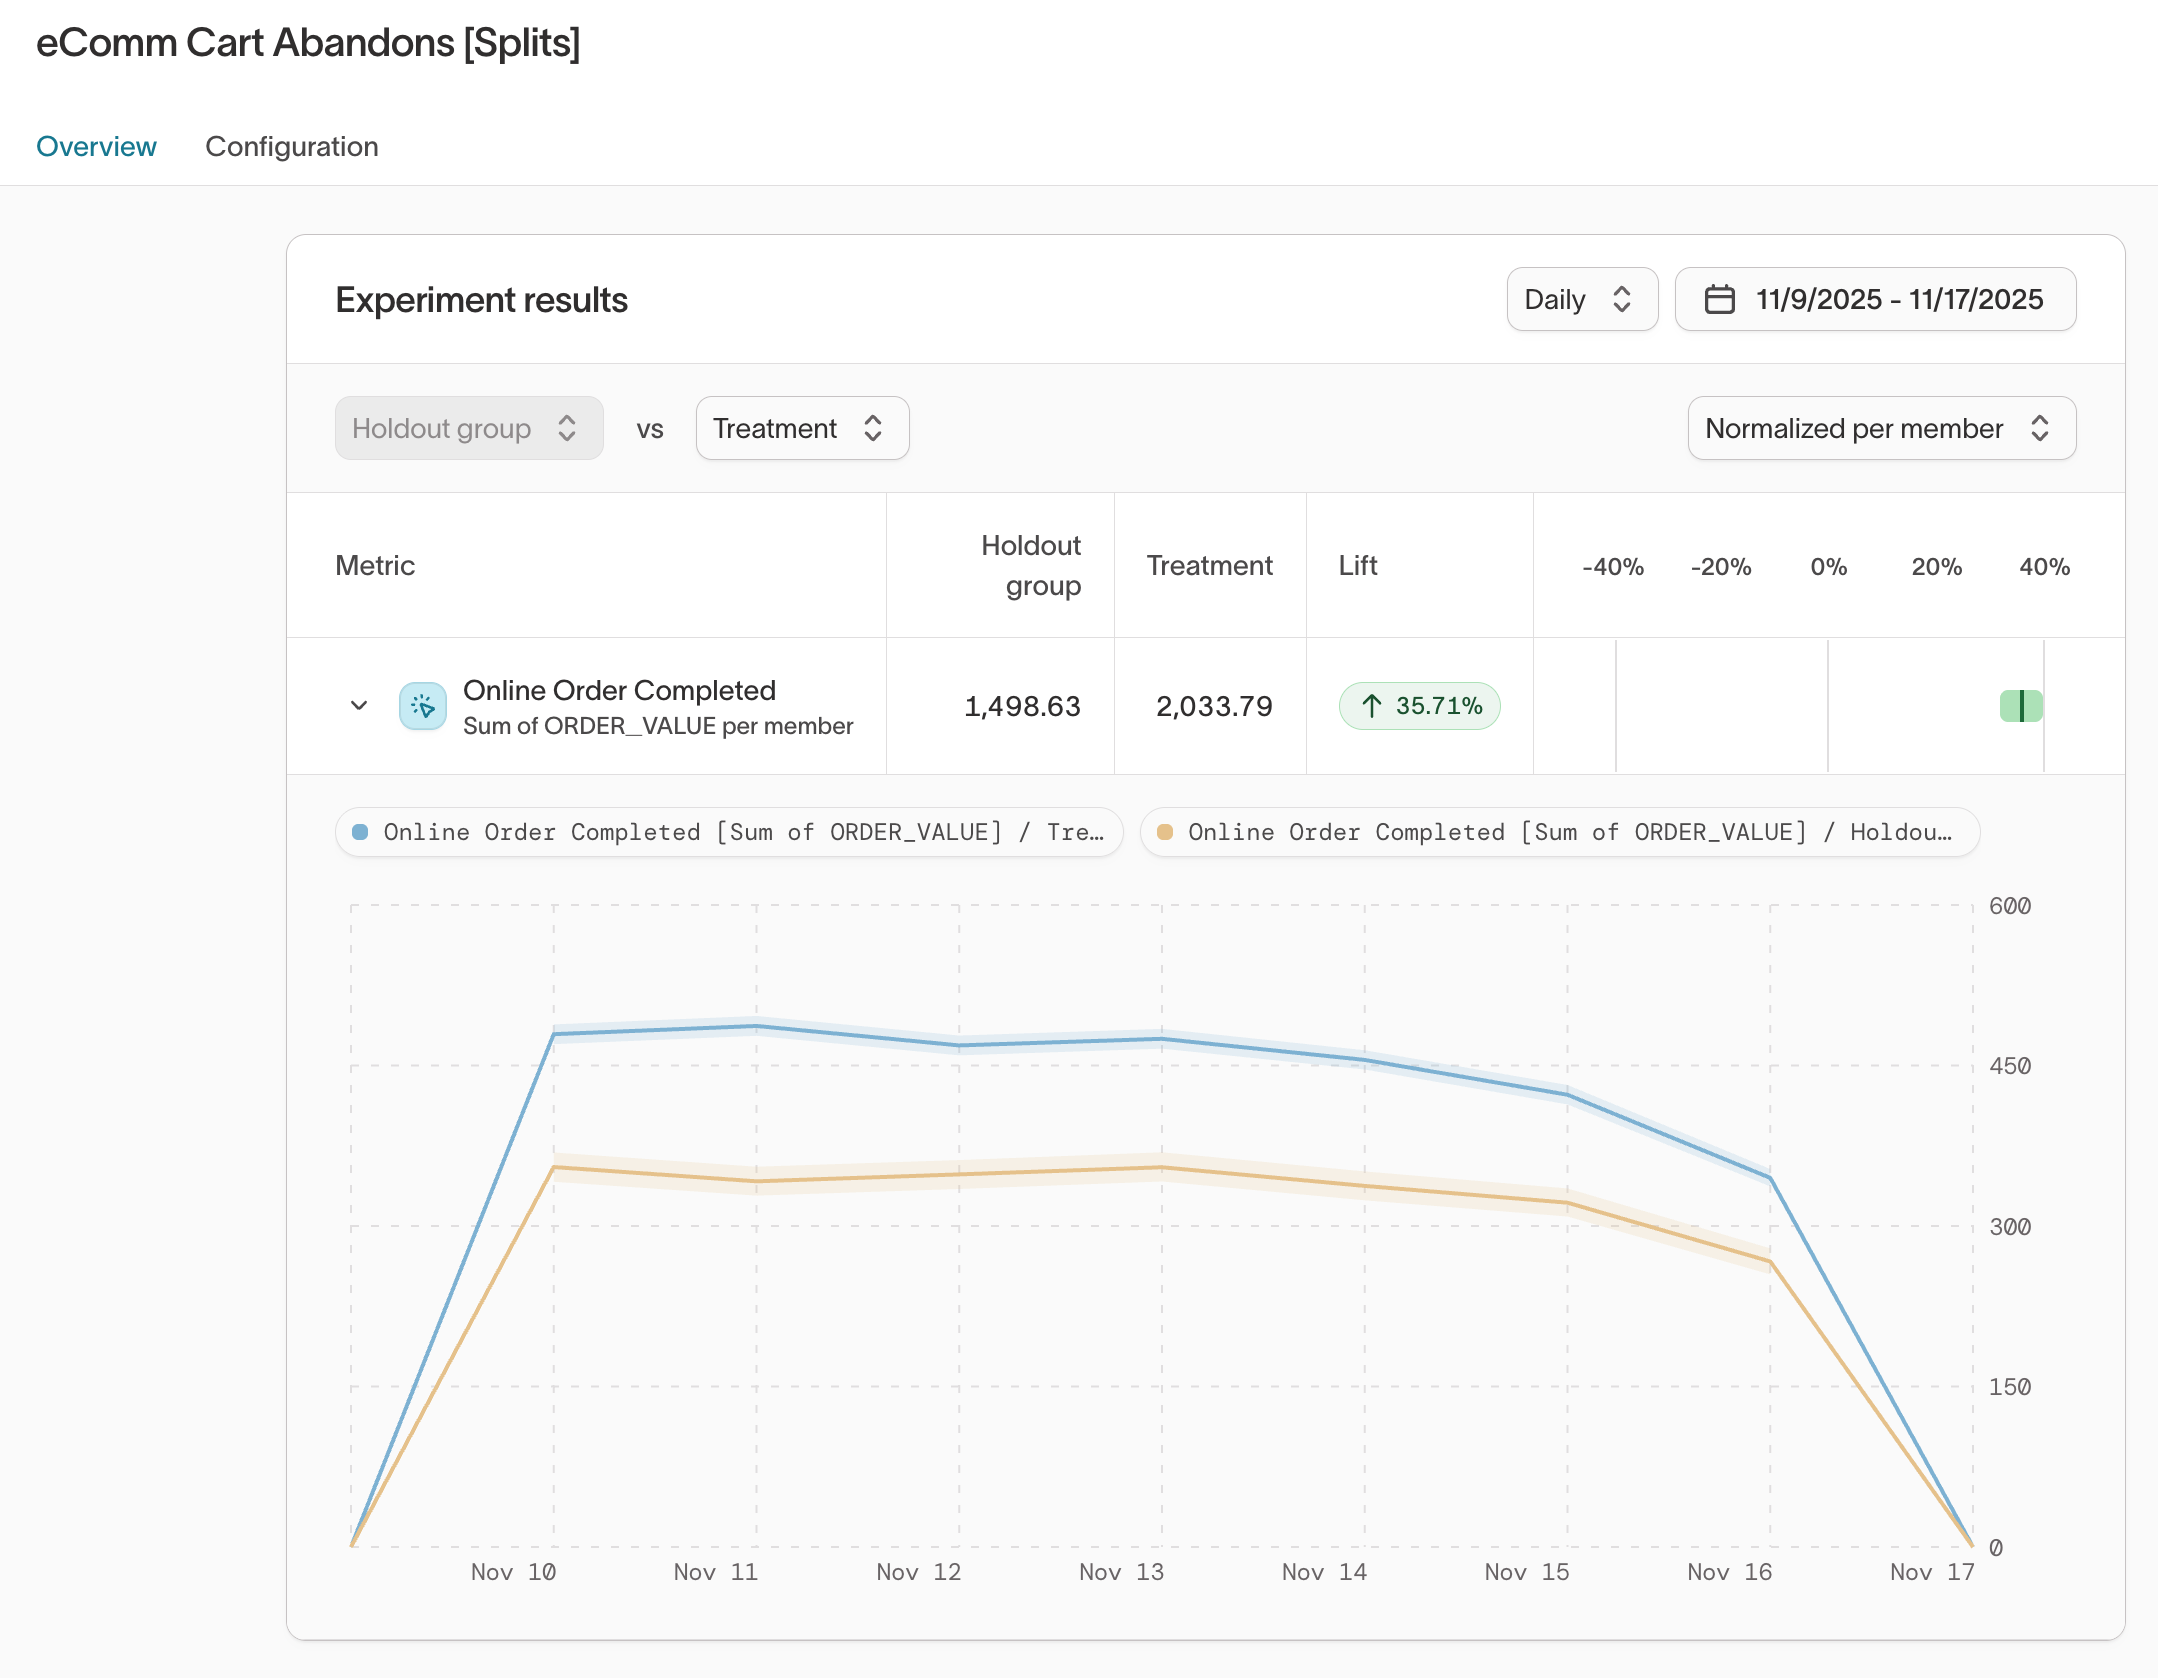
Key elements:
- Lift %: Percentage difference between treatment and holdout group performance.
- Lift interval bar:
- Green: Significant positive lift
- Red: Significant negative lift
- Gray: Not statistically significant (interval overlaps 0%)
- Performance lines:
- Solid lines show performance over time
- Shaded regions represent 95% confidence intervals
Lift intervals use a Bayesian method, enabling continuous monitoring without needing to wait for an experiment to complete.
4. Normalize results
Use the Normalization dropdown to switch perspectives:
- Per member (default): Average performance per user
- Normalized to baseline group: Scales performance to compare groups evenly
Hover over the lift card to view raw totals.