Overview
Hightouch provides a live debugger to provide visibility into each of your sync executions or "runs." The debugger shows all requests and responses Hightouch made to your destination during a sync run. You can access the debugger from the Runs tab of any sync's overview page.
Hightouch stores row-level sync run data for seven days. If you need older logs, consider using Warehouse Sync logs.
View run details
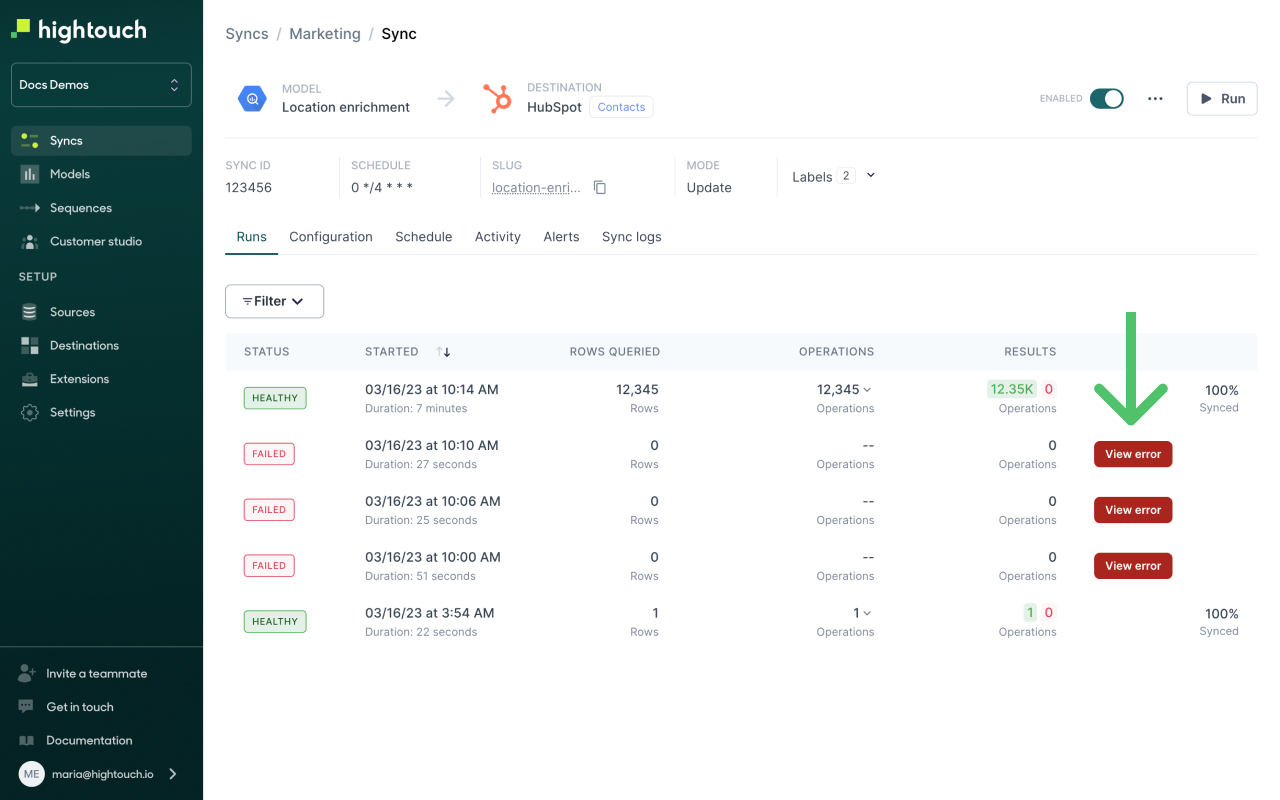
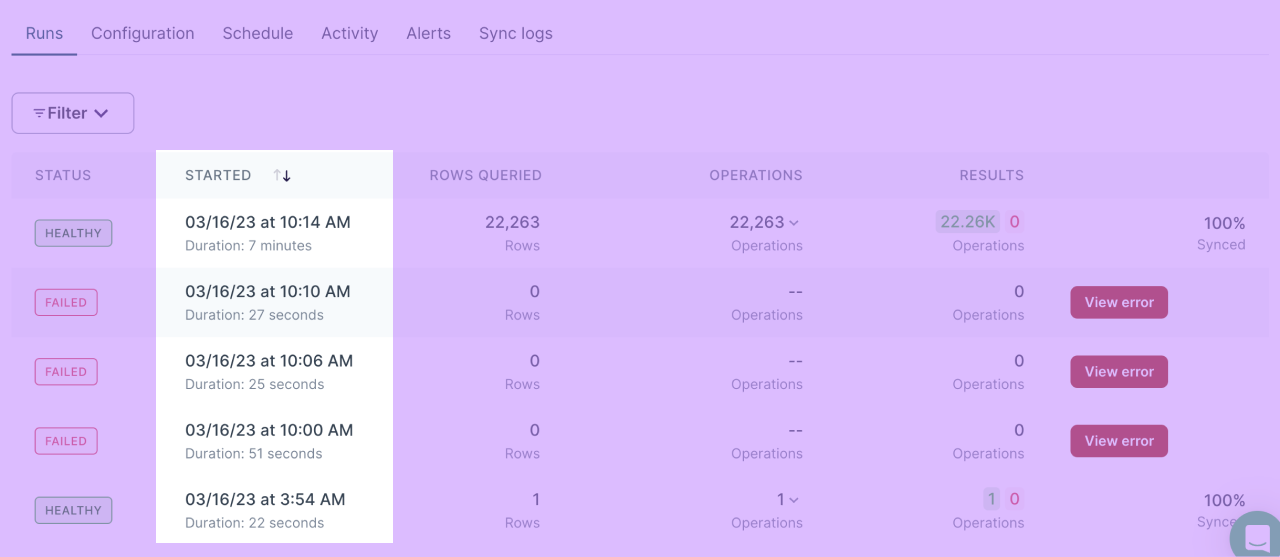
You can see a table of recent sync runs and their statuses and other details from the Runs tab of any sync's overview page.
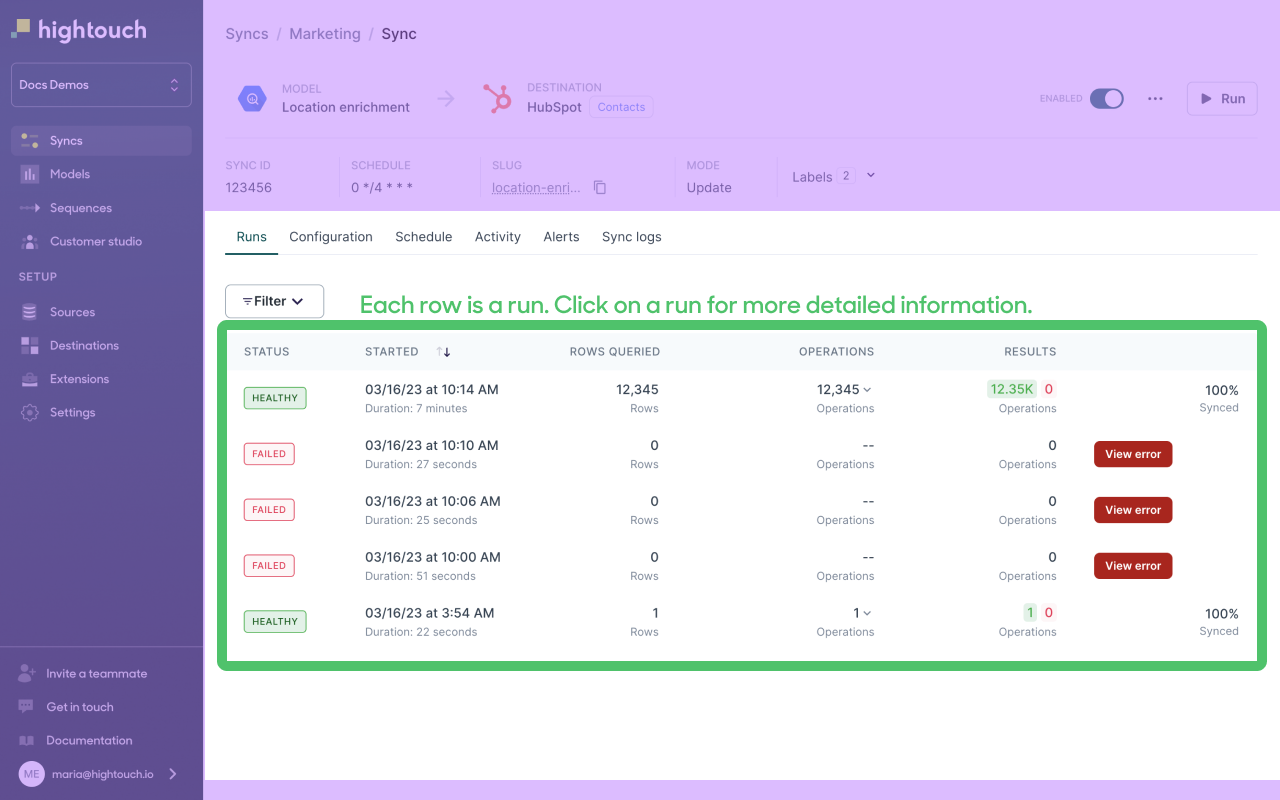
Each row in the table is one sync run. The table shows:
- the run's status: either Querying or Processing if the run is still processing, Completed if the run finished without errors, Completed with errors if the run included some rejected rows, Aborted due to fatal error if the run did not complete, or Cancelled by user if the run was cancelled
- the time the run started and its duration
- the number of rows queried—this is the number of rows in the model's query results
- the number of operations, or updates, sent to the destination
- the results—the number resulting operations, split into successful and rejected operations
You can click a row to open a run's detail page and access the debugger.
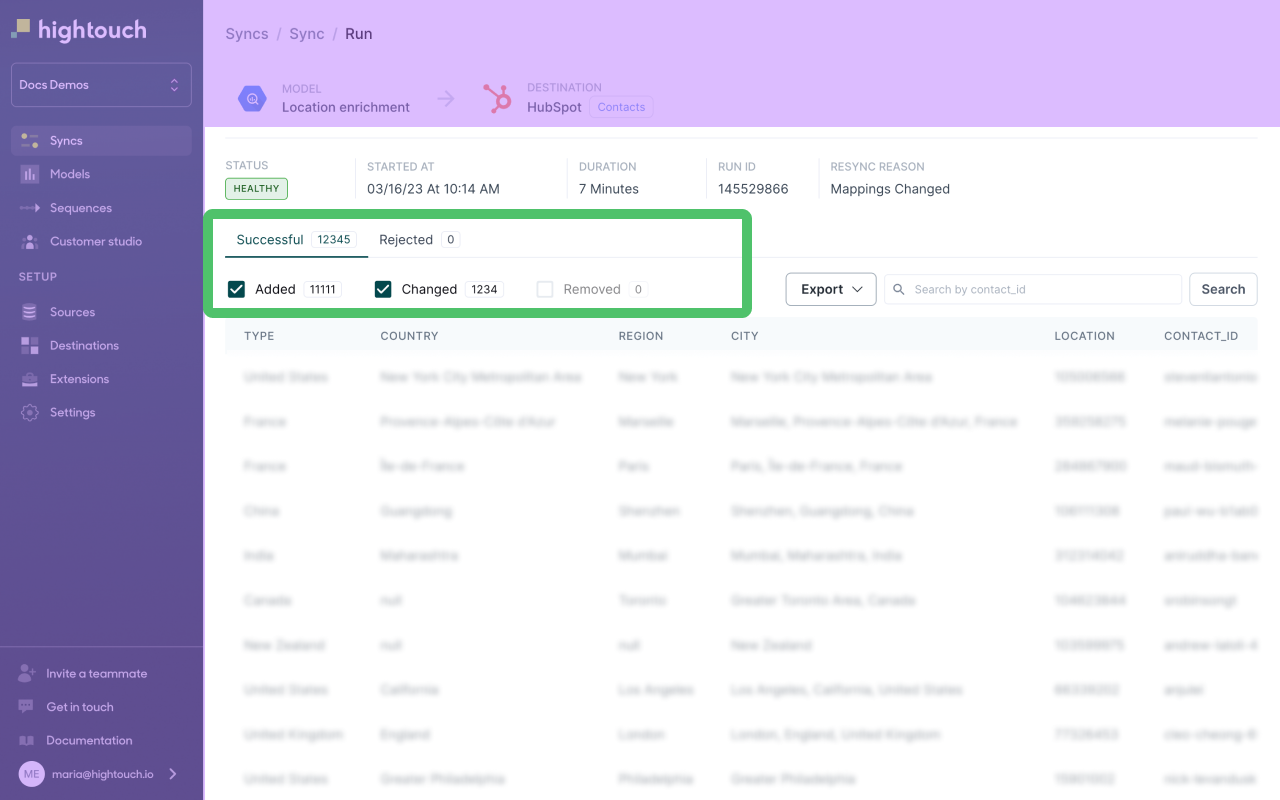
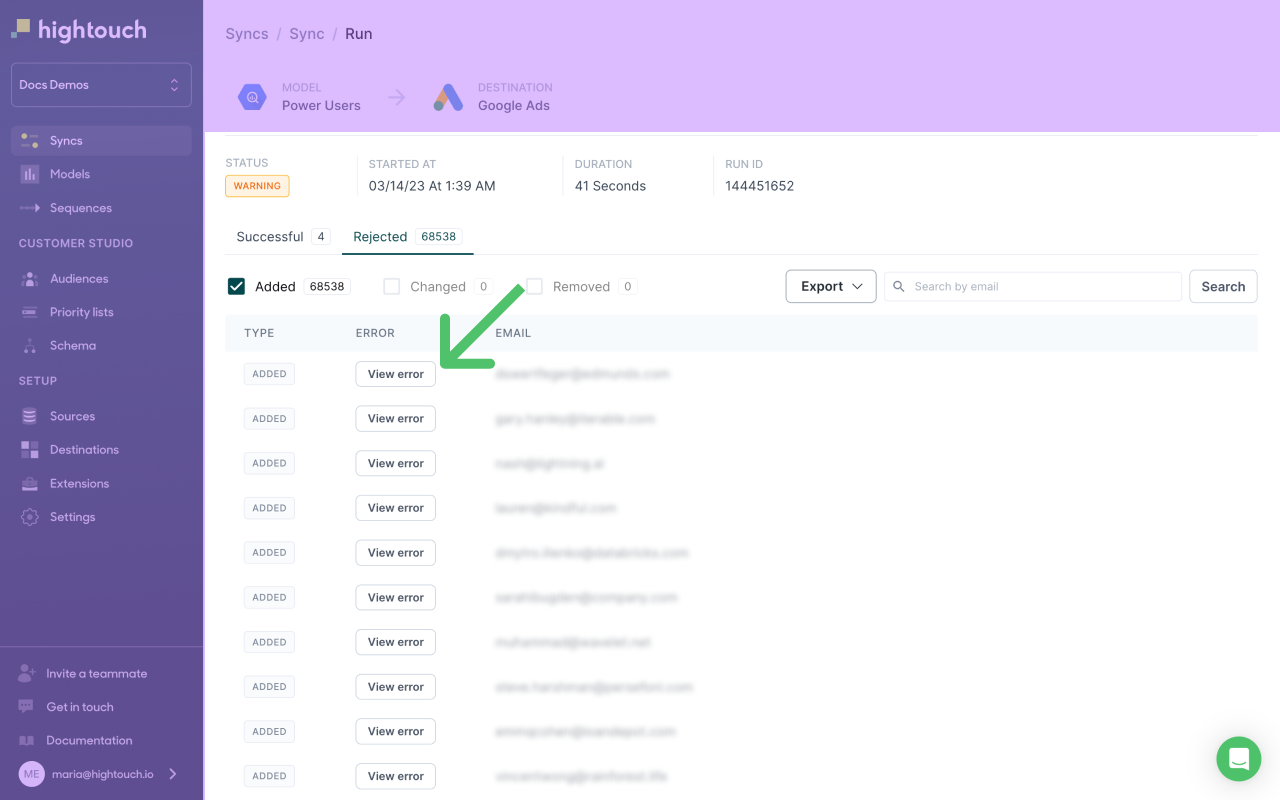
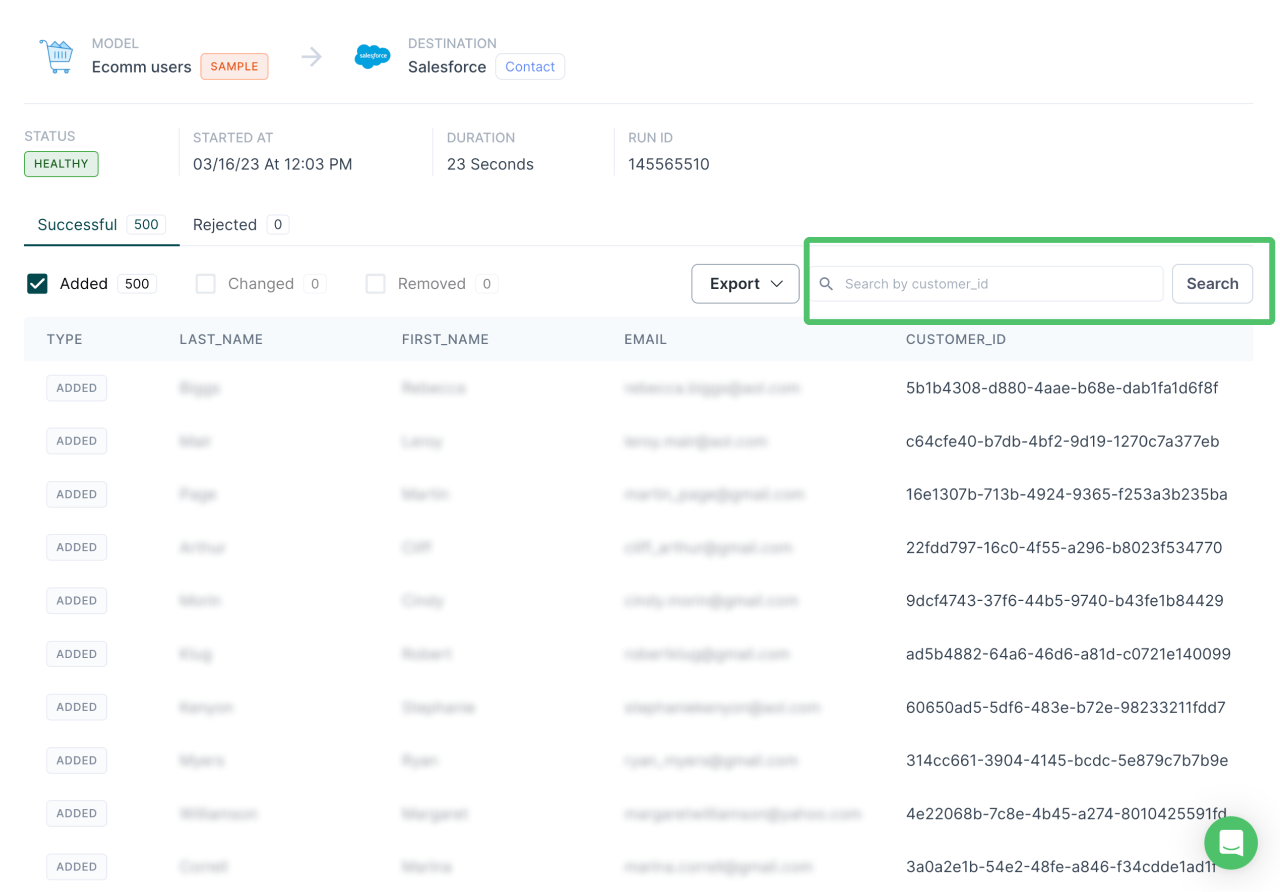
The run detail page shows the number of successful and rejected rows broken down into added, changed, or removed rows.
- Added rows are new rows in the model's query results as compared to the previous run.
- Changed rows were in the previous run's query results but now have updated values.
- Removed rows are those that are no longer in the query results as compared to the previous run.
If the rows appear under the Successful tab, it means the run successfully made the changes in your destination. If the rows appear under the Rejected tab, it means that though the model's query results may have changed, the run couldn't propogate the changes to your destination.
The numbers for added, changed, and removed rows reflect your sync configuration. For example, if you configure a sync using insert mode, Hightouch only shows added rows, even if some rows were removed from your model's query results. If you configure a sync to the HTTP request destination and only configure Rows changed request triggers, you'll only see changed rows, even if some rows were added to or removed from your model's query results.
Sync run status
The preceding example sync run has a healthy status, meaning the sync ran as expected without any rejected rows.
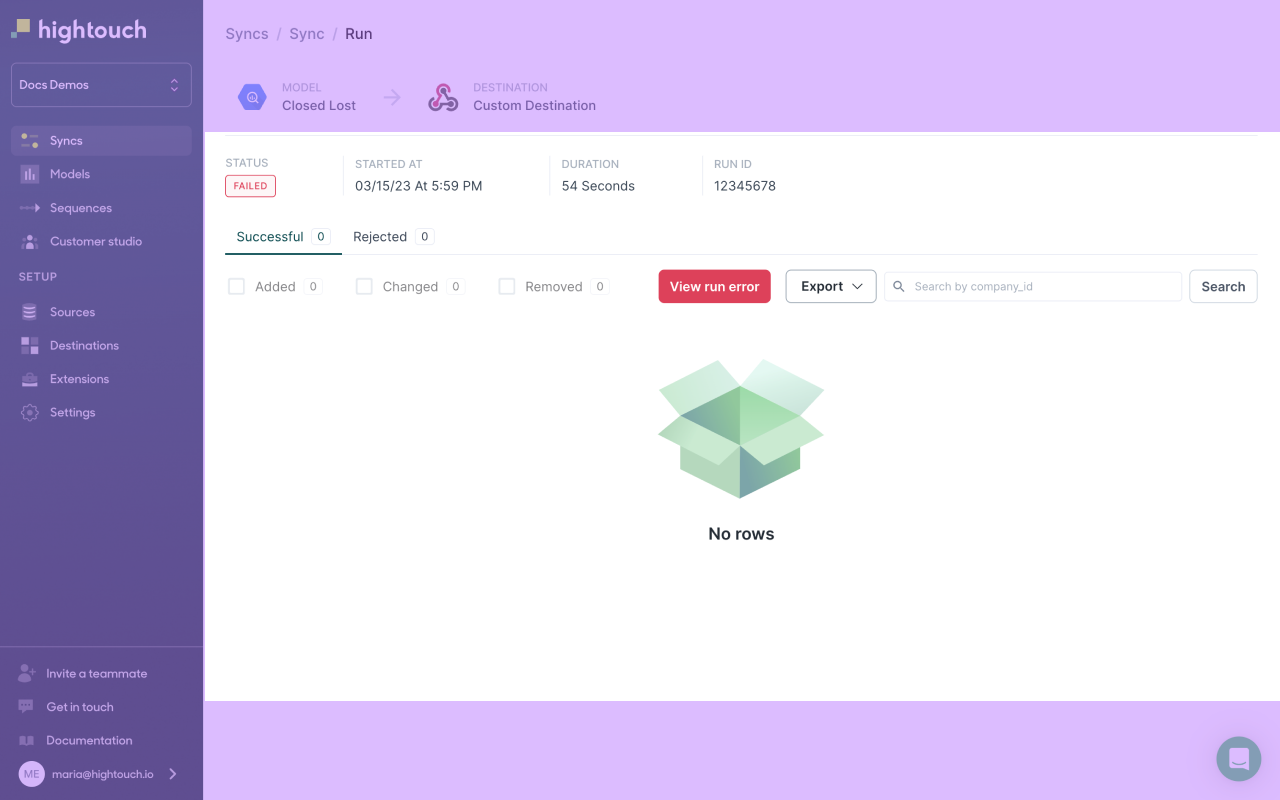
The example sync run below has a Aborted due to fatal error status, meaning it didn't execute as intended.
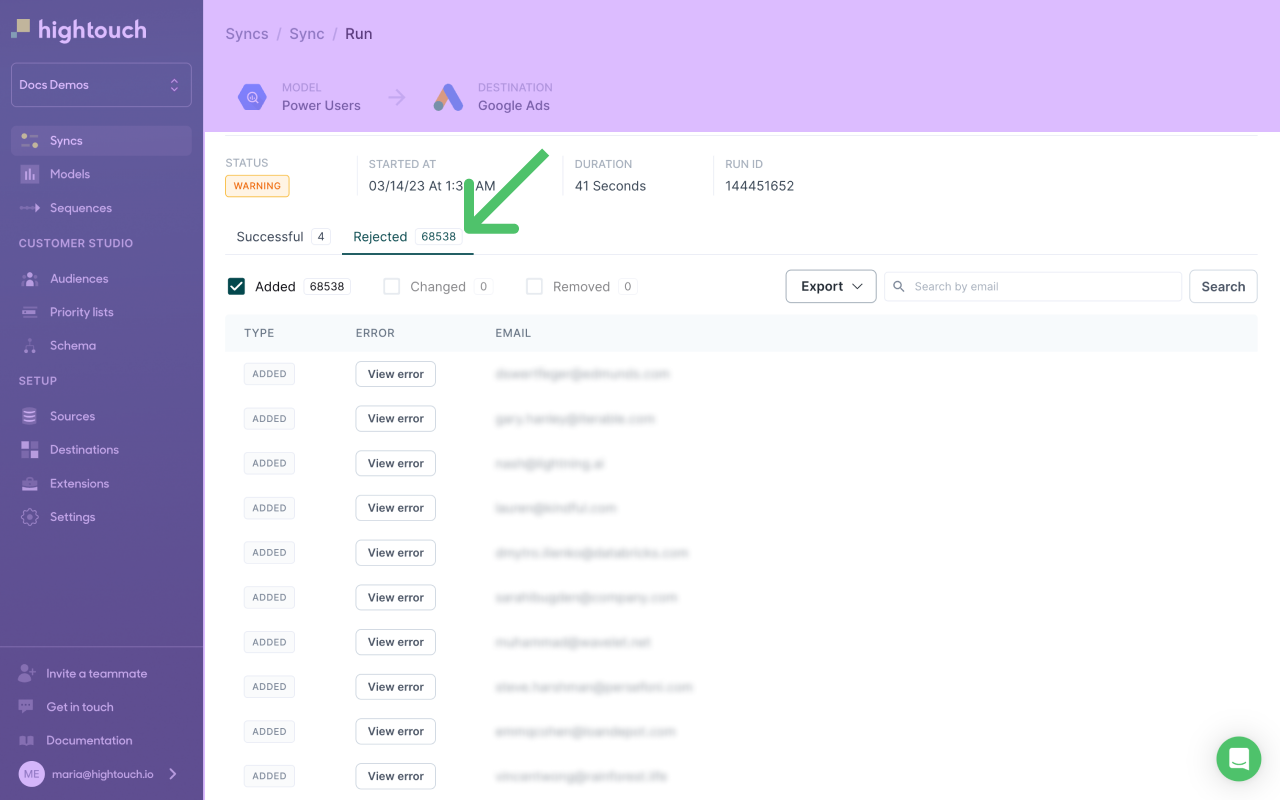
This final example run has a Completed with errors status, meaning the destination rejected at least one row.
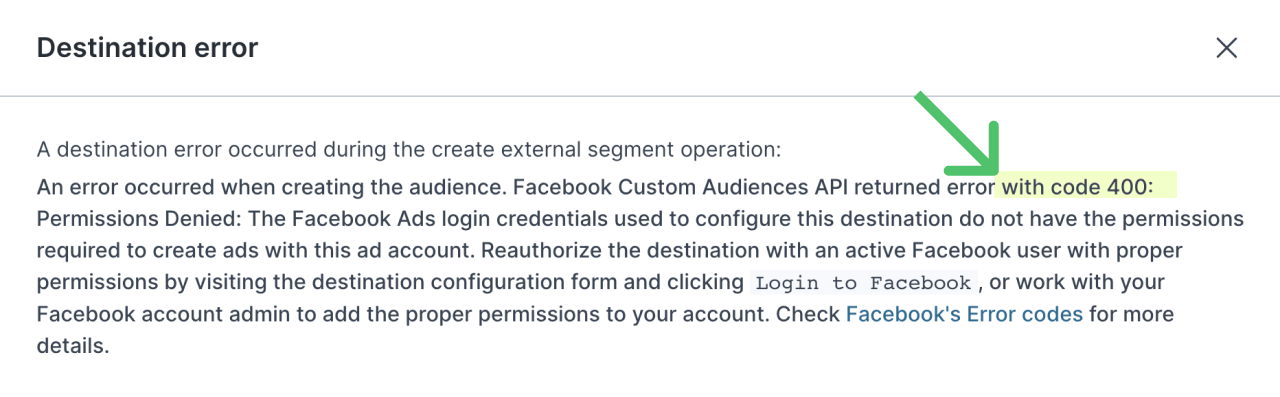
View error messages
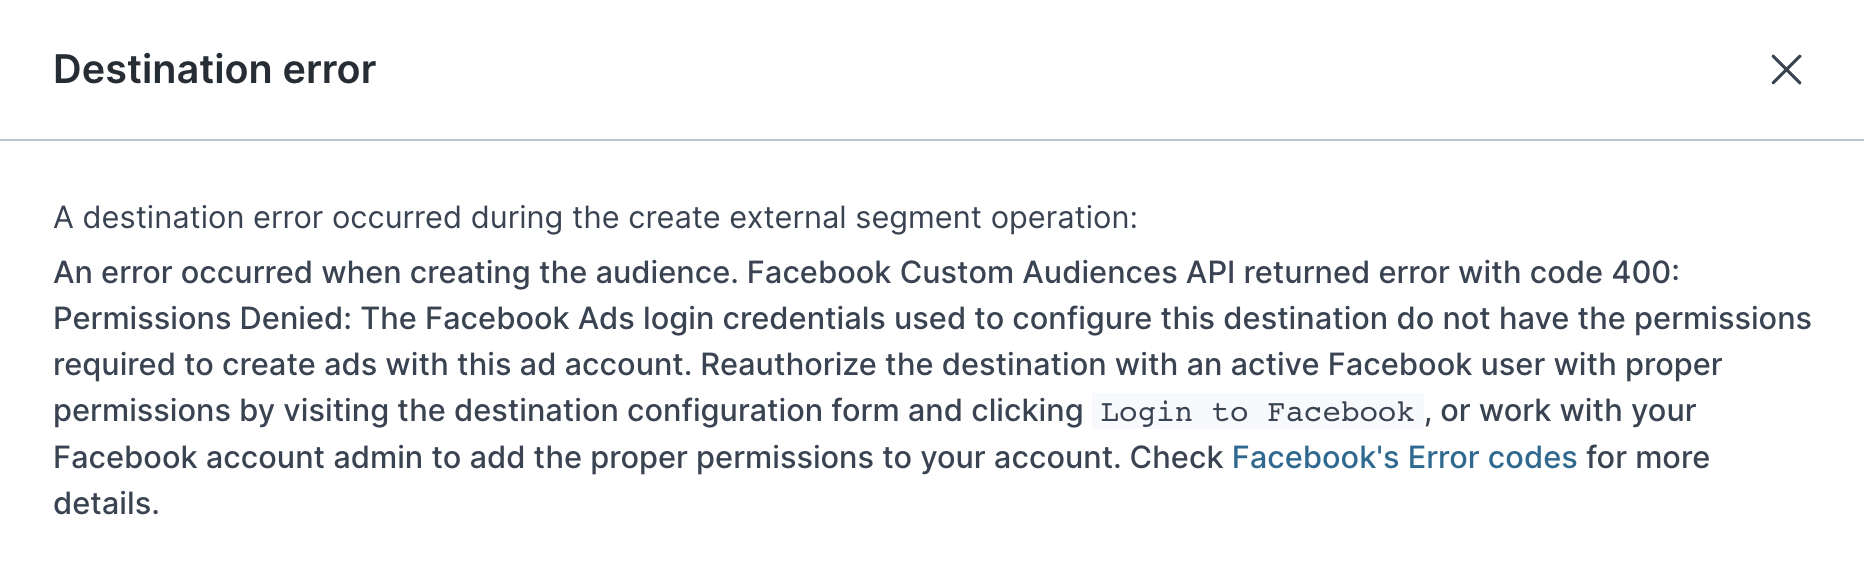
To view an error message for an entire run that failed, click See error message from the Runs overview tab.
Hightouch displays error messages in the format third-party APIs send them, including standard HTTP status codes and any trace IDs, if the third party provides them.
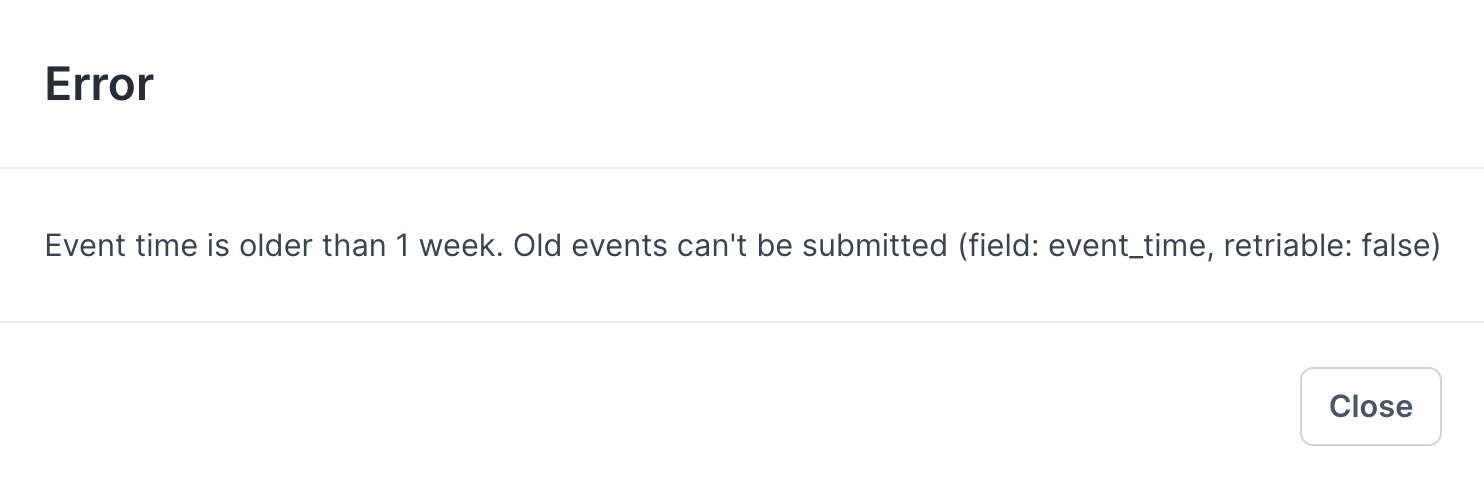
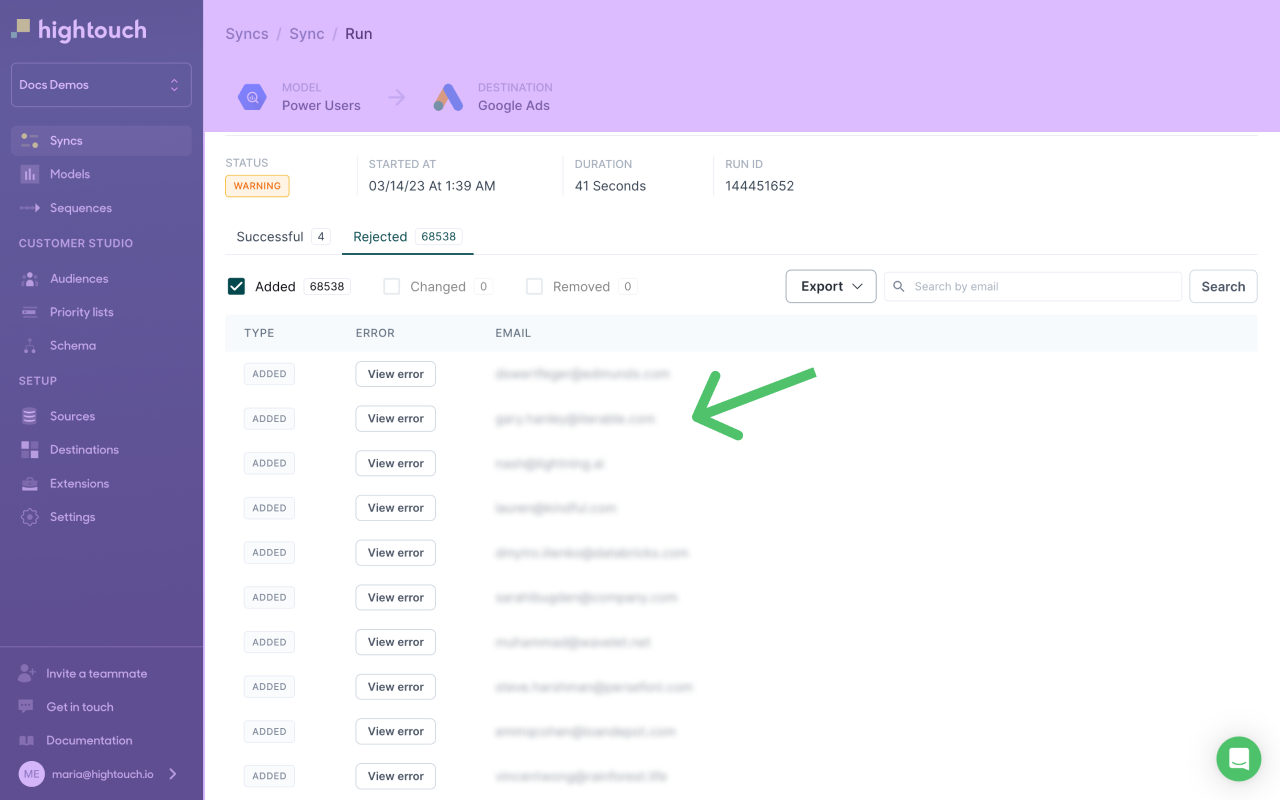
To see a specific row's error message, click View error on the row in the run's detail page table:
Hightouch displays error messages provided by the third-party API related to individual rows.
If the run fails during query execution with warehouse SQL errors, see Resolve SQL compilation errors.
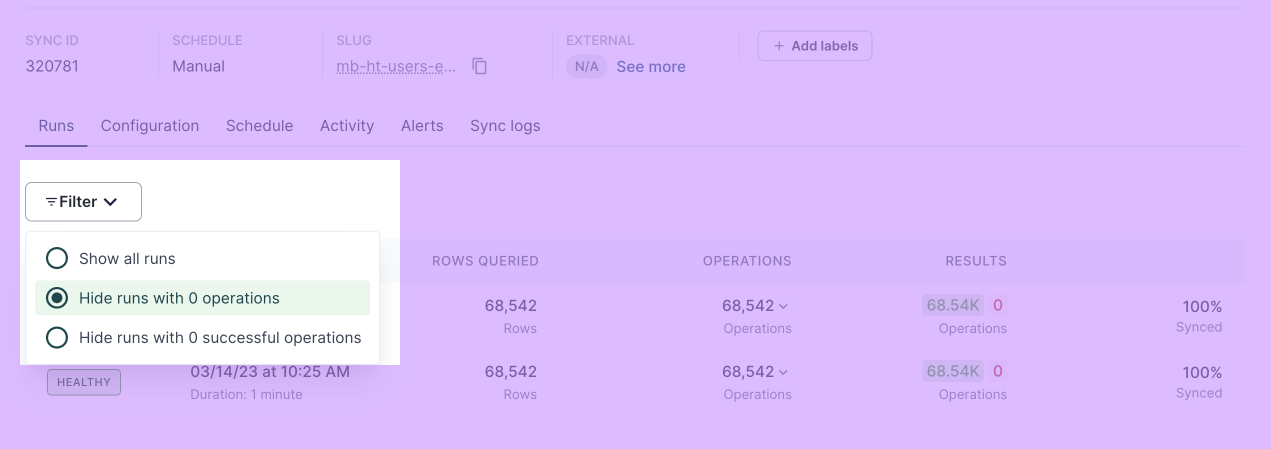
Filter runs
To narrow down the runs to inspect, you can use the Filter option to hide runs with either zero operations or zero successful operations.
Search rows
Use the search input above the run details table to find a row with a primary key that matches the search value. This search only searches through the column you selected as the model's primary key.
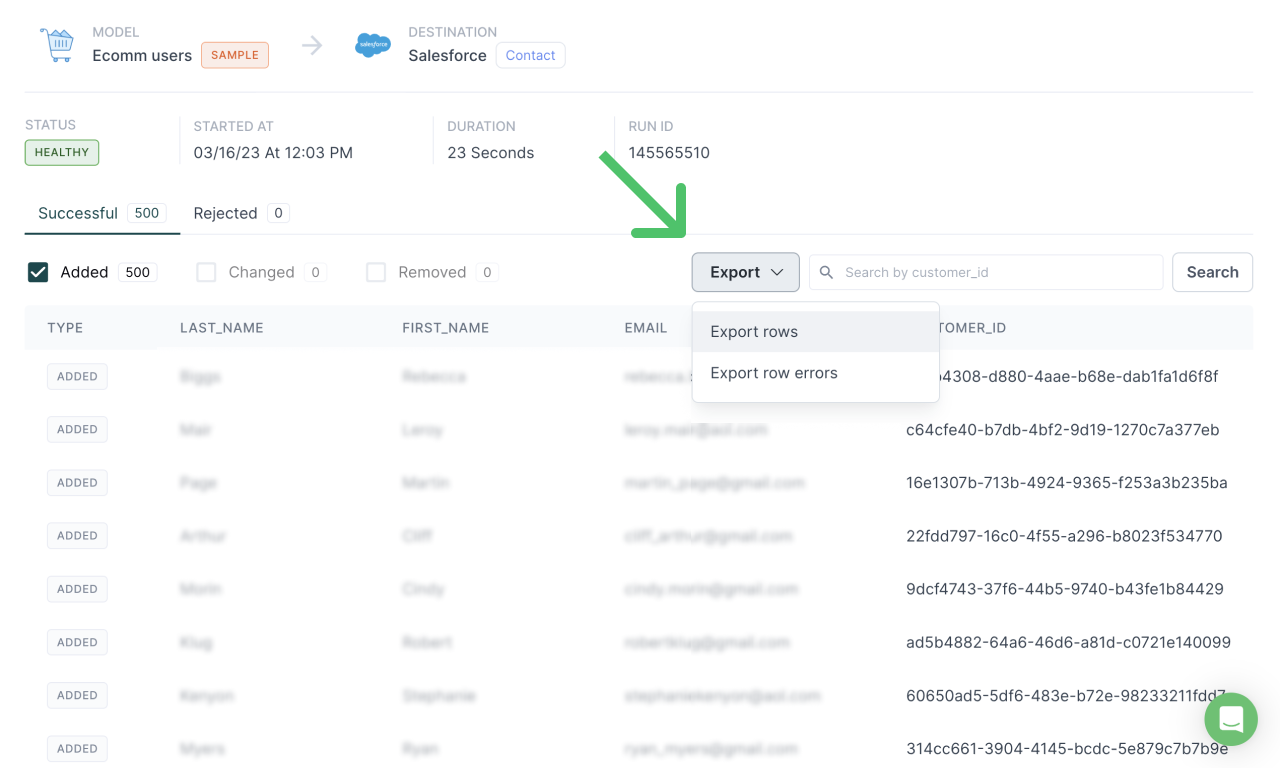
Export rows and row errors
You can also export the data from all rows or just row errors as a CSV or JSON file.
Note: exporting requires workspace admin permissions.
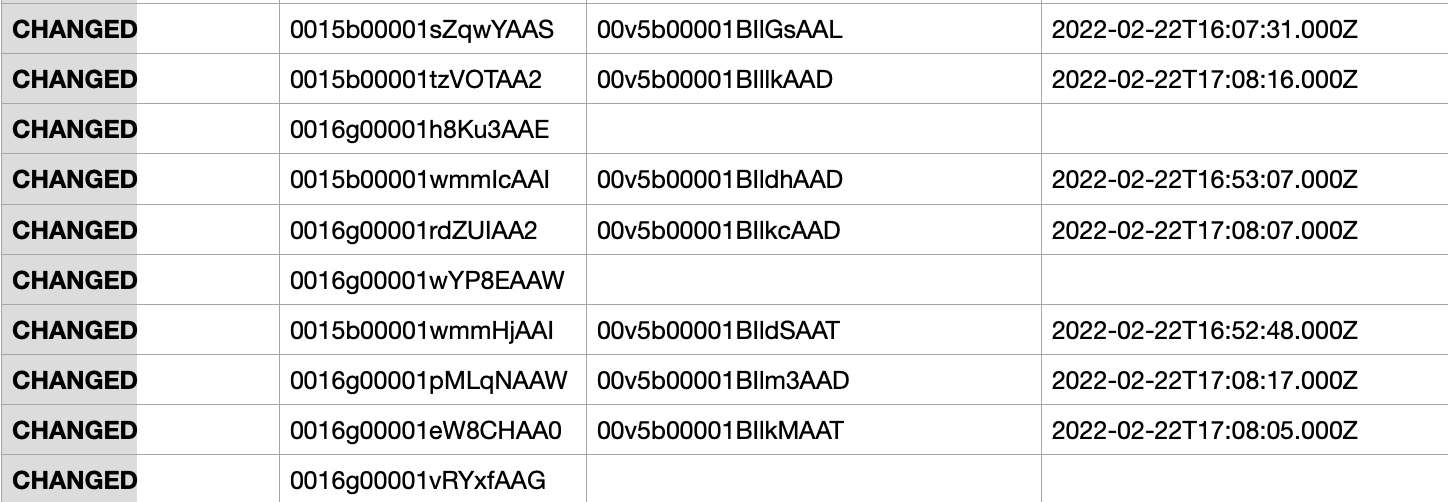
You can then inspect the file to see details of rows the sync run added, changed, or deleted:
Or, download and then inspect just the row errors:
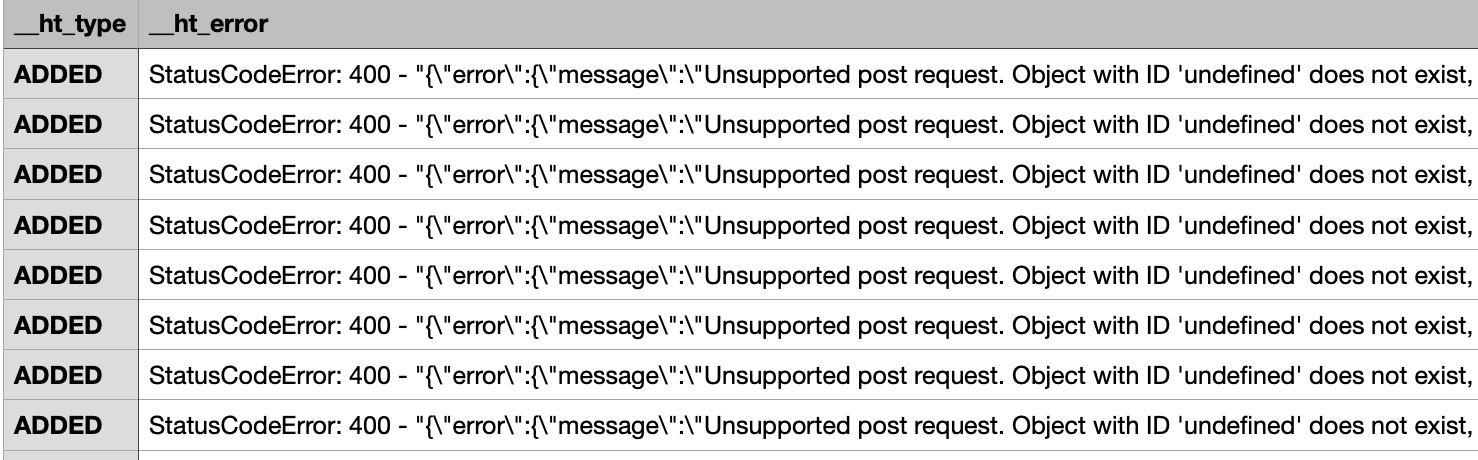
Use your CSV editor's search feature to locate rows or specific error messages more quickly.
Use the live debugger
To take a closer look at the individual HTTP requests and responses that comprise a sync run, click any row to open the live debugger.
The live debugger shows the request and response JSON payloads of which the row was part and the other rows that were part of the batch.
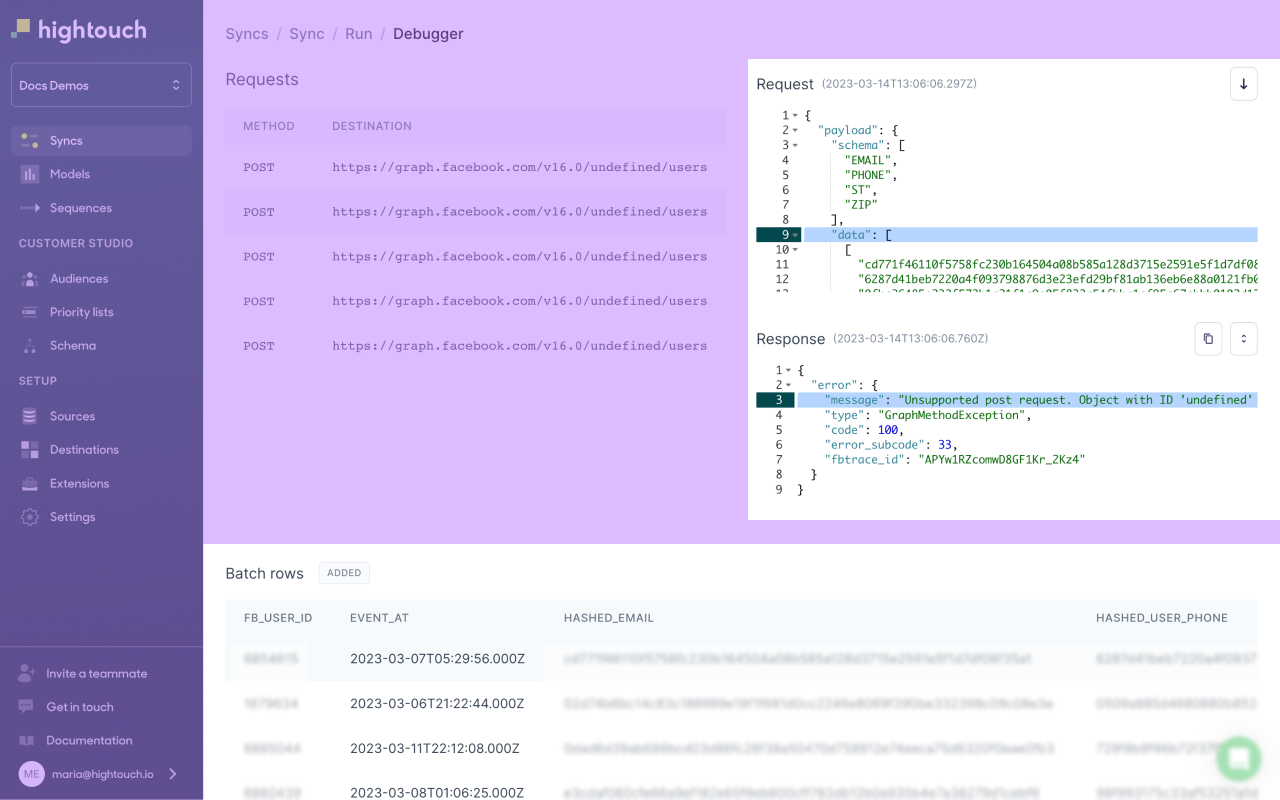
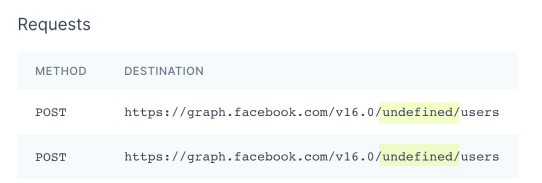
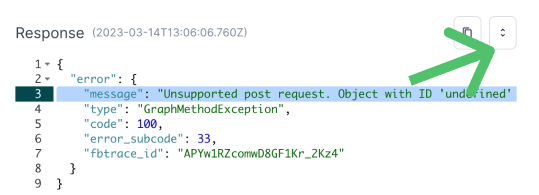
In this example, the POST request to update this batch failed because of a 400 error. The response displays the third-party error message saying there was an undefined object in the request:
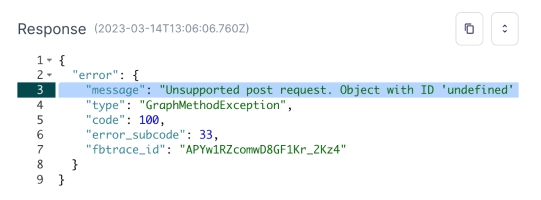
Hightouch displays the request's URL for diagnostic purposes. An undefined sub-URL means that the row ID number needed for this POST request failed to populate the URL. The next step would be to inspect the query results returned from the model.
Payload inspection
To expand a payload for closer inspection, click the expand icon in the top right corner of the payload viewer.
Once expanded, you can scroll through the payload or click in the payload body and use Ctrl/Command-F to open a search window. Use the search window to find row IDs, email addresses, or any other payload data you need to inspect or trace.
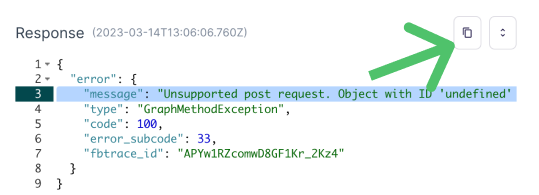
To copy the payload, click the copy button in the top right corner of the payload viewer; the browser saves the payload to your clipboard.
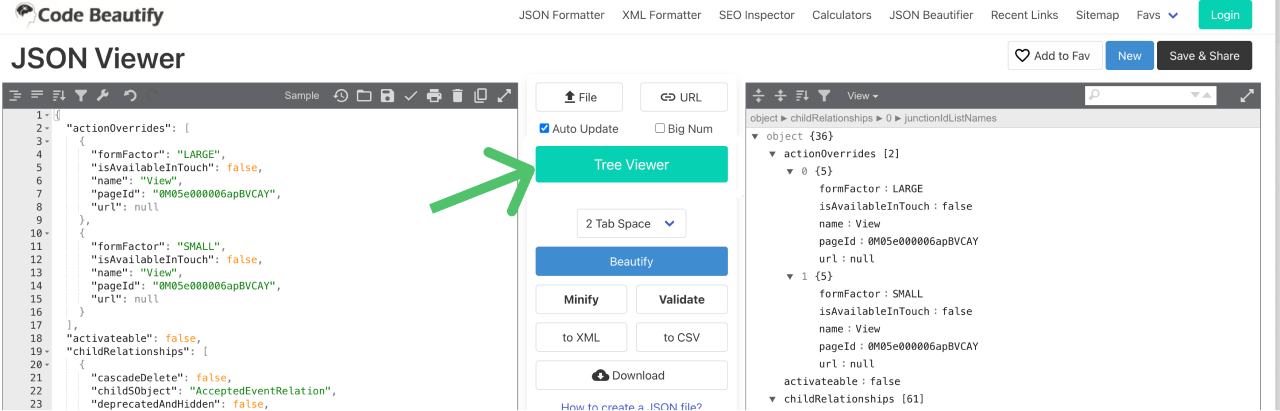
For large, nested JSON payloads, it's helpful to paste the JSON into a viewer like CodeBeautify to view the payload's structure and values. Click Tree viewer to inspect the JSON as collapsible properties:
Hightouch debugging tips
Filter runs
When you have a large number of runs to inspect, use the run filter to narrow down your view to only the runs you want to inspect.
Run timestamps
Use the run timestamps to isolate the runs you need to inspect based on your observation of when an error occurred. Run timestamps appear in your local timezone under the header Started.
Search the live debugger
Use the live debugger to search payloads for missing rows or to see how Hightouch sent the data to your destination. Expand the payload viewer and use command+F to search for entities you need to inspect.
Search error messages
Hightouch returns error messages directly from third-party APIs as they occur. Therefore, you will likely find more information and solutions by copying and pasting the error message into your favorite search engine or Stack Overflow.
Some destinations also have active developer communities where you can find explanations for common error messages:
Understand HTTP status codes
Hightouch displays any HTTP status codes your destination includes in the HTTP response. These universal status codes can help you understand what may have gone wrong with your sync. If you see an HTTP status code in your Hightouch error message, it comes from your destination, not from Hightouch.
HTTP status codes are grouped into five categories:
- 1xx Informational Response: The destination request was received and understood. Request processing continues.
- 2xx Success: The request was successfully received, understood, and accepted.
- 3xx Redirection: The client must take further action to complete the request.
- 4xx Client Errors: The client caused an error. The request contains the wrong syntax or can't be fulfilled.
- 5xx Server Errors: The server encountered an error and failed to fulfill the request.
See Mozilla's documentation for further information on HTTP status codes.
Common status codes in Hightouch
The most common status codes Hightouch syncs receive are:
-
200 success: This is good news and means your destination successfully received and accepted the request from Hightouch.
-
400 status: A 400 error often means there is invalid data. Check that your data conforms to the destination's formatting expectations by referring to the destination's API documentation.
-
401 status: A 401 error often means there is a problem with the credentials you've used to set up your destination. Check that your credentials have the correct permissions to access the destination.
500 series (500, 502, 504, etc.) errors are "server errors," meaning something has gone wrong within the destination you are trying to sync to. Visit the status page of the destination to see if there are any reported outages, for example, Slack System Status or HubSpot Status.
If a sync fails because of a destination server error, Hightouch retries the sync.
Data types and casting
Third-party APIs require the data you send to be of a specific data type. Unless otherwise specified, Hightouch takes the data from your source and leaves the data type unchanged to send to your destination. See the data types and casting docs for tips on resolving data type incompatibilities.