| Audience | How you’ll use this article |
|---|---|
| Marketing teams | Understand where events come from, how they’re monitored, and how event health impacts real-time activation and personalization. |
| Data teams | Learn how incoming events are validated, inspected, governed, and made reliable for downstream use. |
| Engineering teams | Monitor event volume, debug payloads, validate schemas, and configure alerts to catch issues early. |
What you’ll learn
By the end of this article, you’ll be able to:
- Add or configure an event source
- Monitor event volume and health
- Explore events in the event catalog
- Set up alerting for event behavior
- Inspect events using the debugger
- Configure SDK for event source
Overview
An event source represents a system that sends events into Hightouch, such as a web app, mobile app, backend service, or data pipeline.
Event sources are the starting point for all event-based workflows in Hightouch, including event storage, event streaming, and downstream activation.
Supported SDKs
Hightouch provides several SDKs (software development kits) that you can deploy to your app or site in order to start collecting events. There are separate SDKs for:
For server-side ingestion without an SDK, use the HTTP API. You can also collect events directly from Kafka, PubSub, and Webhooks, and inspect events in a web-based debugger to confirm you're capturing them correctly from each source.
Please note that there is a 96 kilobytes size limit for each event that's collected.
Regions
Events runs in US East (aws-us-east-1), EU West (aws-eu-west-1), and Asia Pacific – Mumbai (aws-ap-south-1). See the Events overview for the current list and how to request another region.
Add or configure an event source
To add or manage an event source:
- Go to https://app.hightouch.com/?from=docs
- Navigate to
Event Collection → Event sources - Click Add source to create a new event source, or
- Select an existing source from the list to begin monitoring, debugging, or configuration
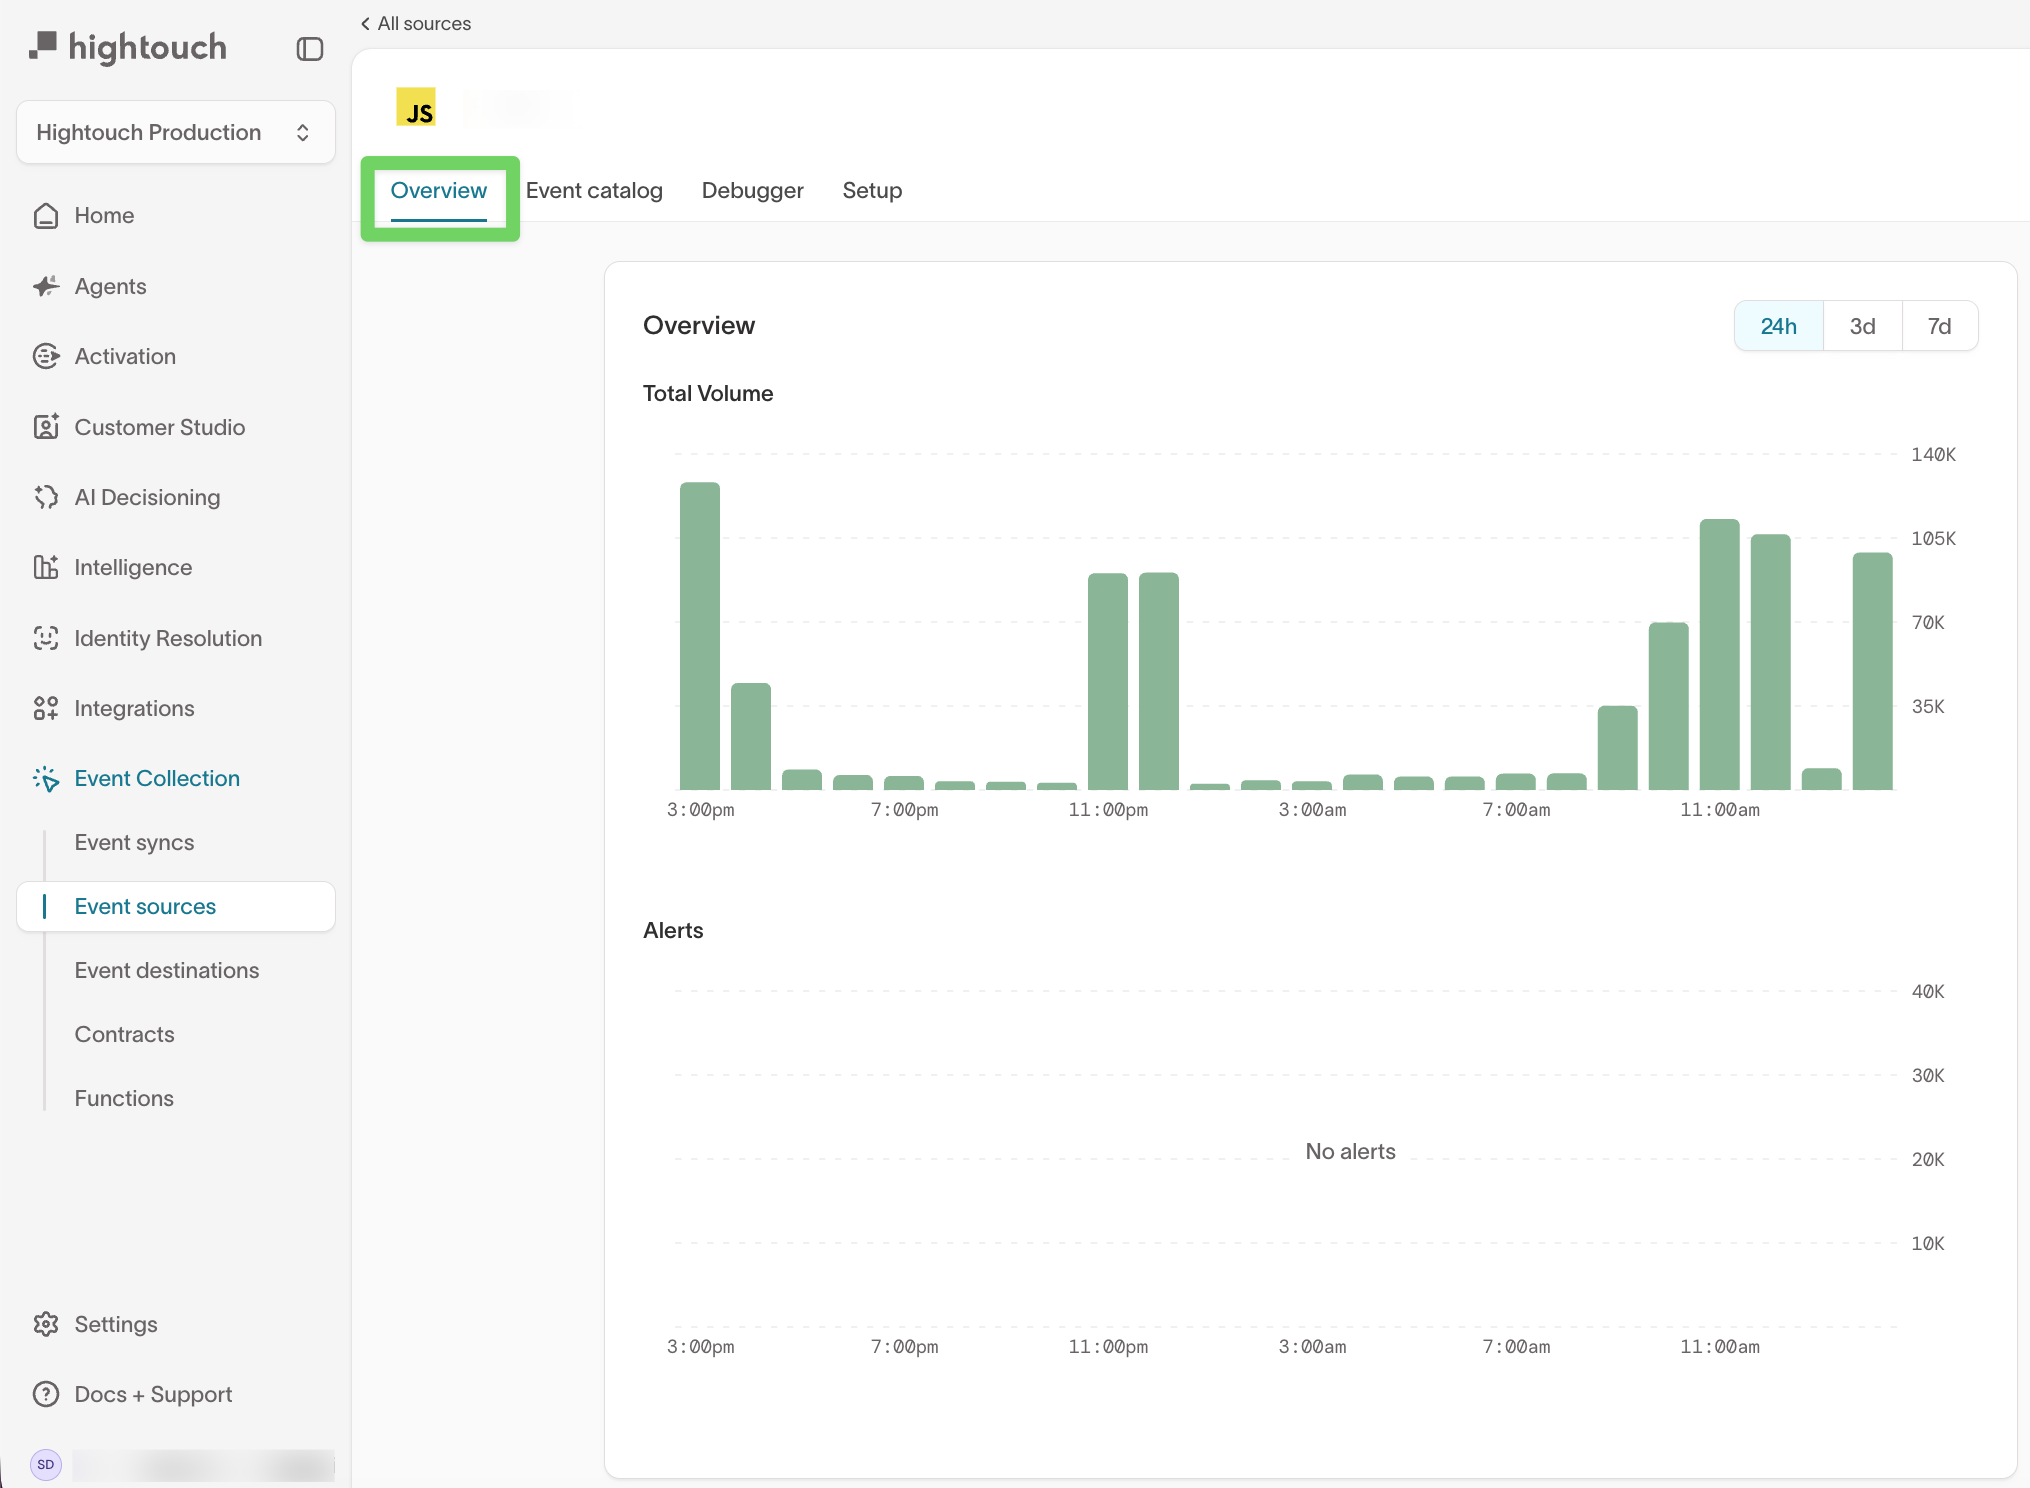
Monitoring and overview
The Overview tab provides a high-level view of event activity for a single source.
From this view, you can:
- Monitor total event volume over time
- Identify gaps, drops, or spikes in traffic
- See whether any alerts are currently active
Use the time range controls (24h, 3d, 7d) to analyze recent changes or longer-term trends.
This view is typically used to answer questions like:
- Is this source actively sending events?
- Did volume change after a release or deployment?
- Are any alerts firing that require investigation?
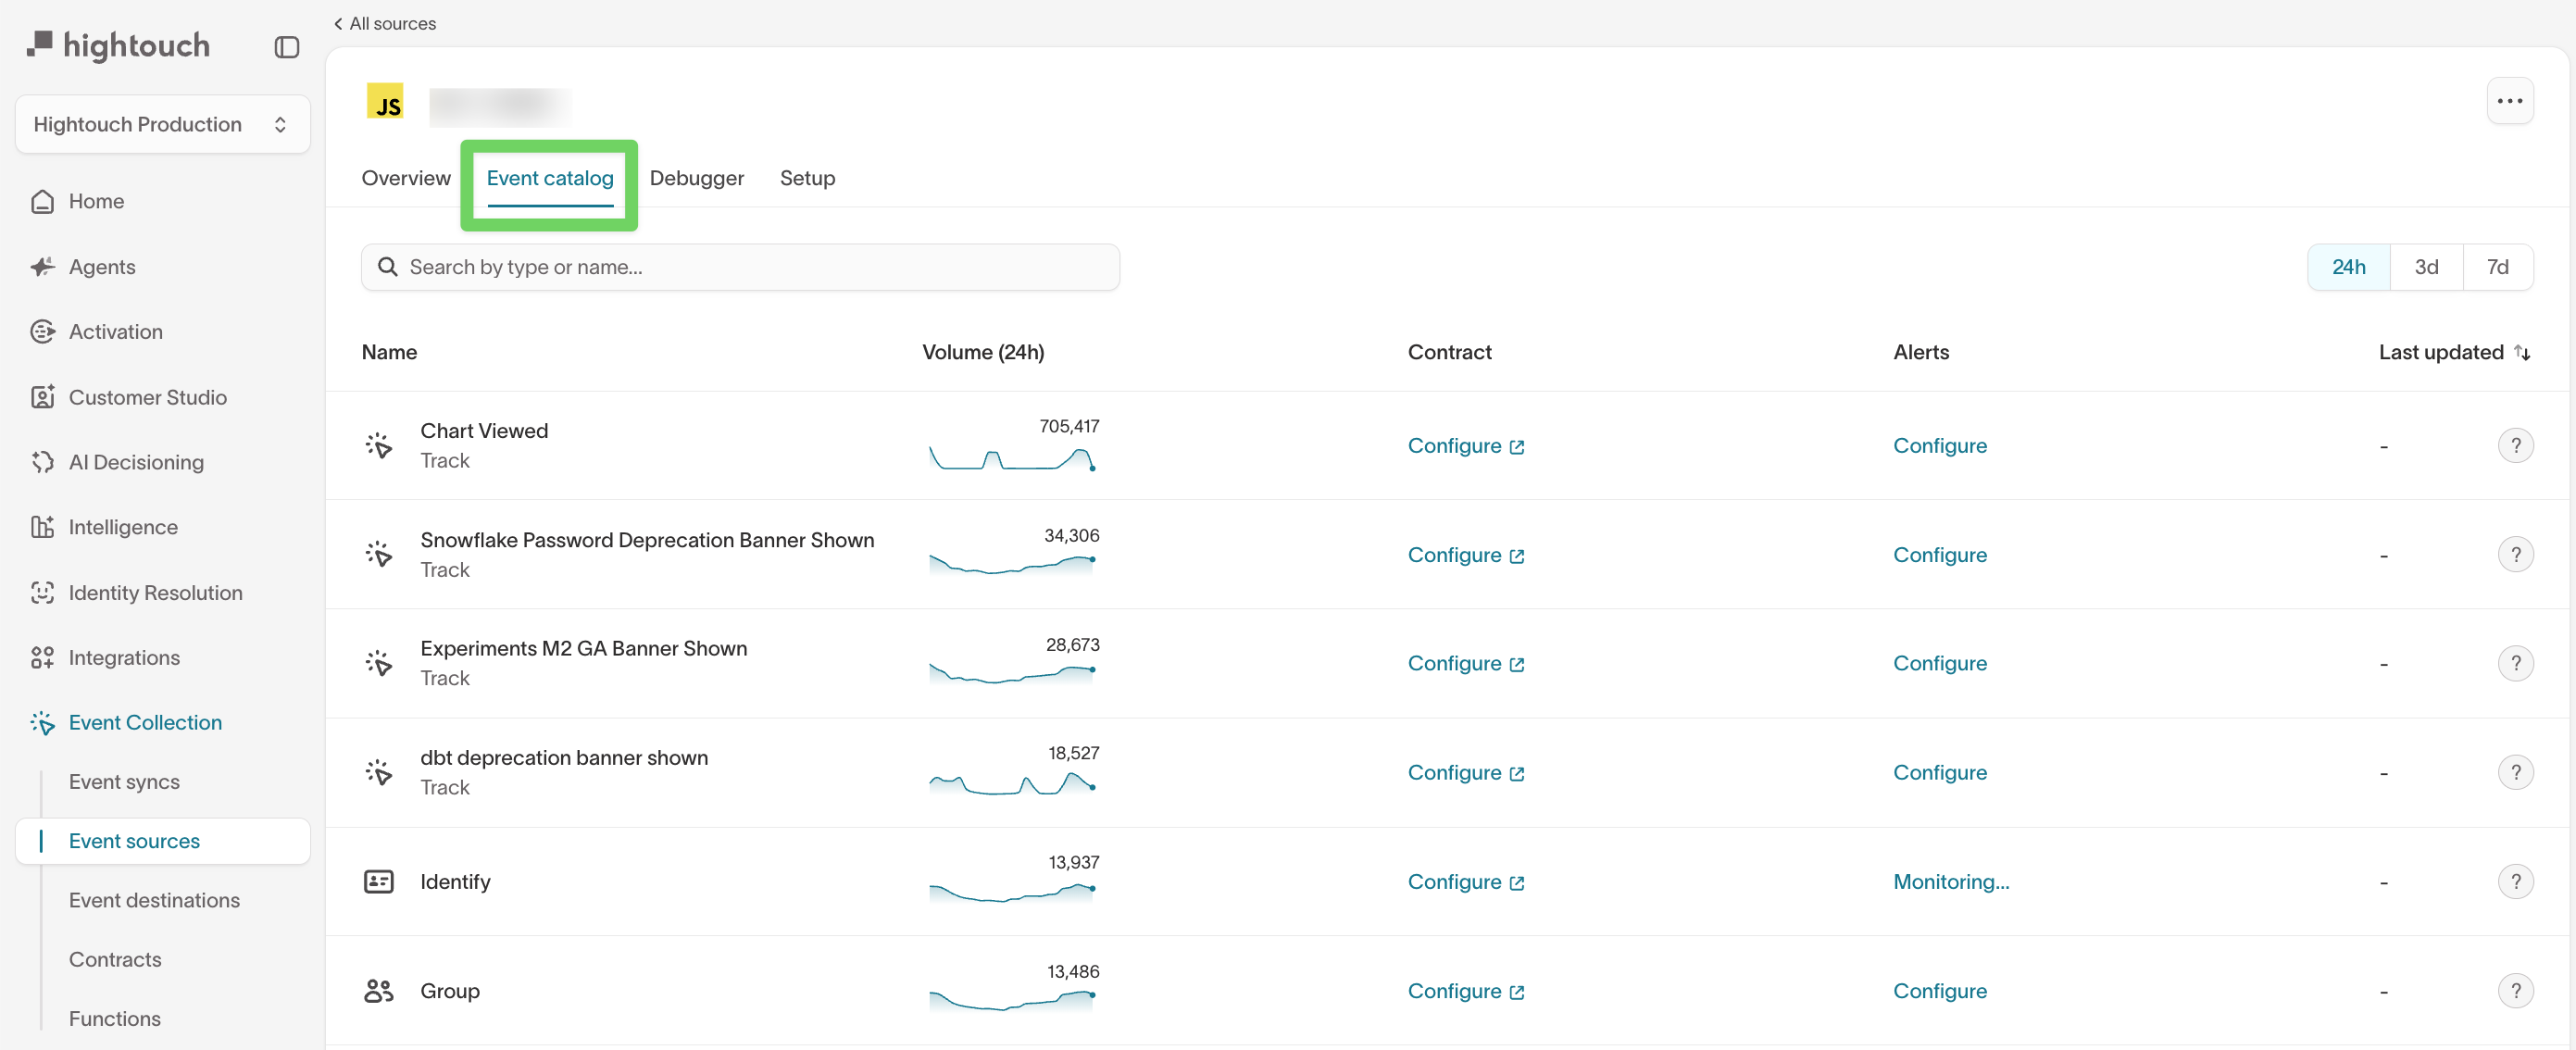
Event catalog
The Event catalog lists all event types received from the source, along with their recent volume and configuration status.
For each event, you can:
- View the event name and type (for example,
Track,Identify, orGroup) - Monitor event volume over time
- Configure data contracts to validate schema and required fields
- Set up alerts for volume-based changes
New event types appear in the catalog after they are received for the first time. This may take a few minutes after initial instrumentation.
Use the event catalog to:
- Understand which events are actively being sent
- Identify high- or low-volume events
- Decide where schema validation or alerting is needed
Alerting
Alerting helps you detect unexpected changes in event behavior.
Alerts are configured at the event level from the Event catalog.
Navigate to alerting:
- Go to
Event Collection → Event sources - Select an event source
- Open the
Event catalogtab - Find the event you want to monitor
- Click Configure in the Alerts column
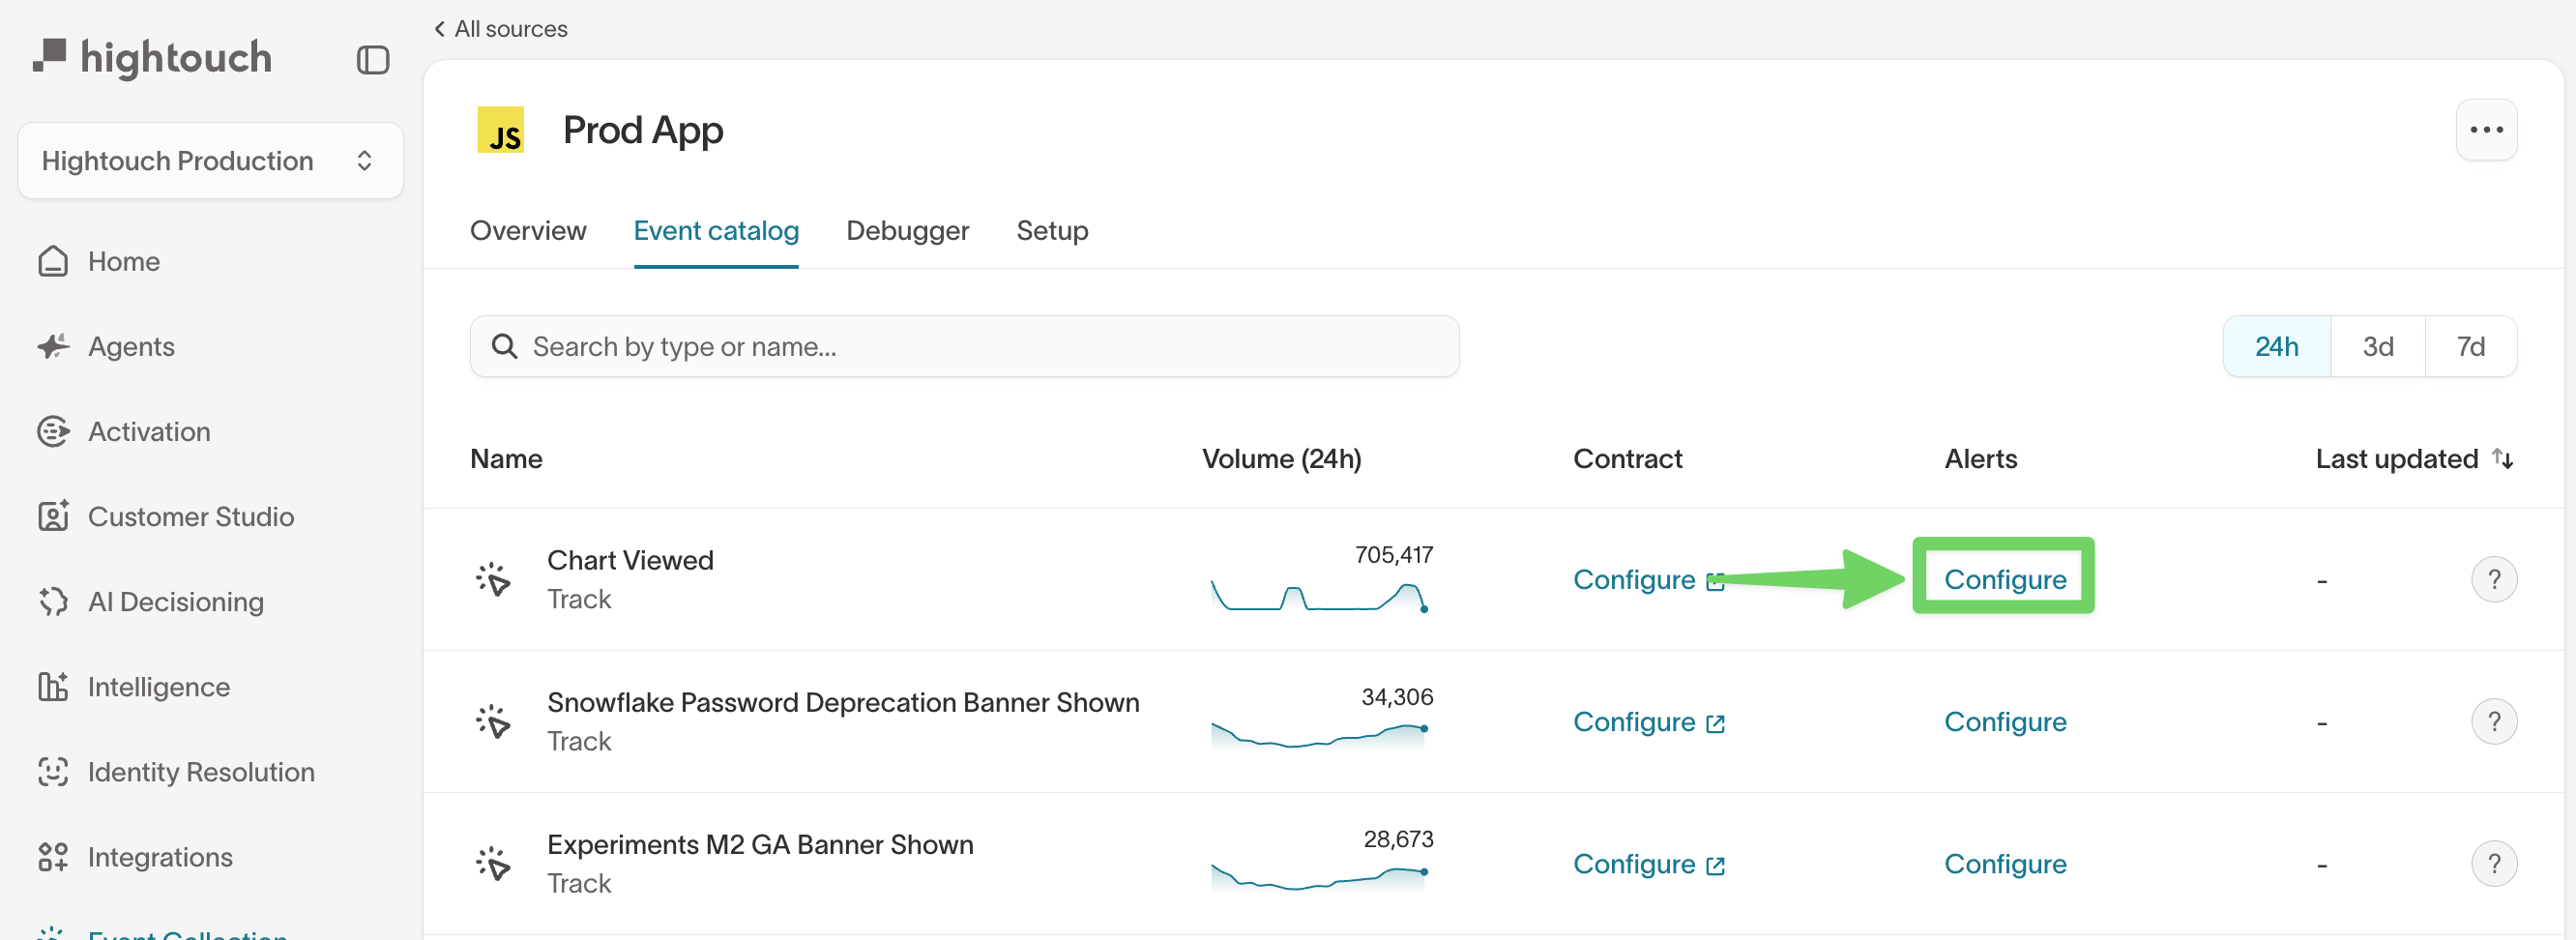
This opens the event’s Alerting panel, where you can review alert history, define triggers, and configure recipients.
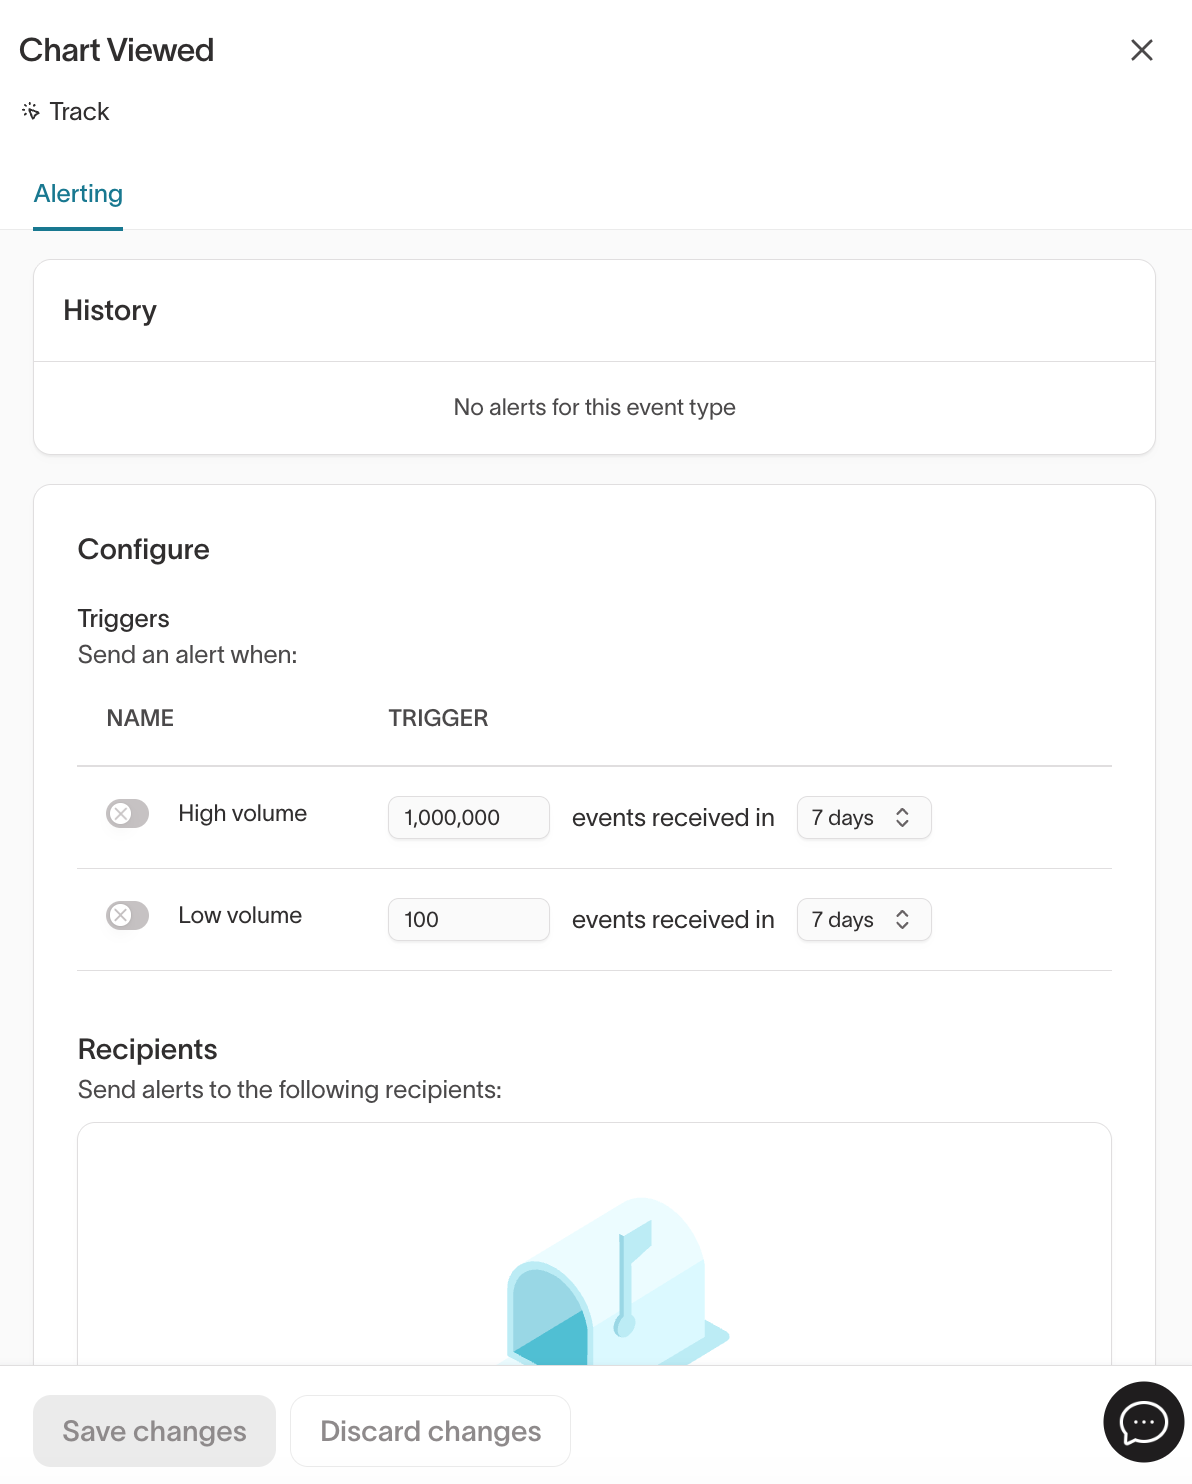
From this panel, you can configure alerts to notify your team when:
- Event volume exceeds a high threshold
- Event volume drops below a minimum threshold
Alerts can be sent to external notification channels, such as email or messaging tools, so teams can respond quickly to issues.
Alerting is commonly used to:
- Detect broken or stalled event pipelines
- Catch unintended increases in event volume
- Monitor critical events that power downstream workflows
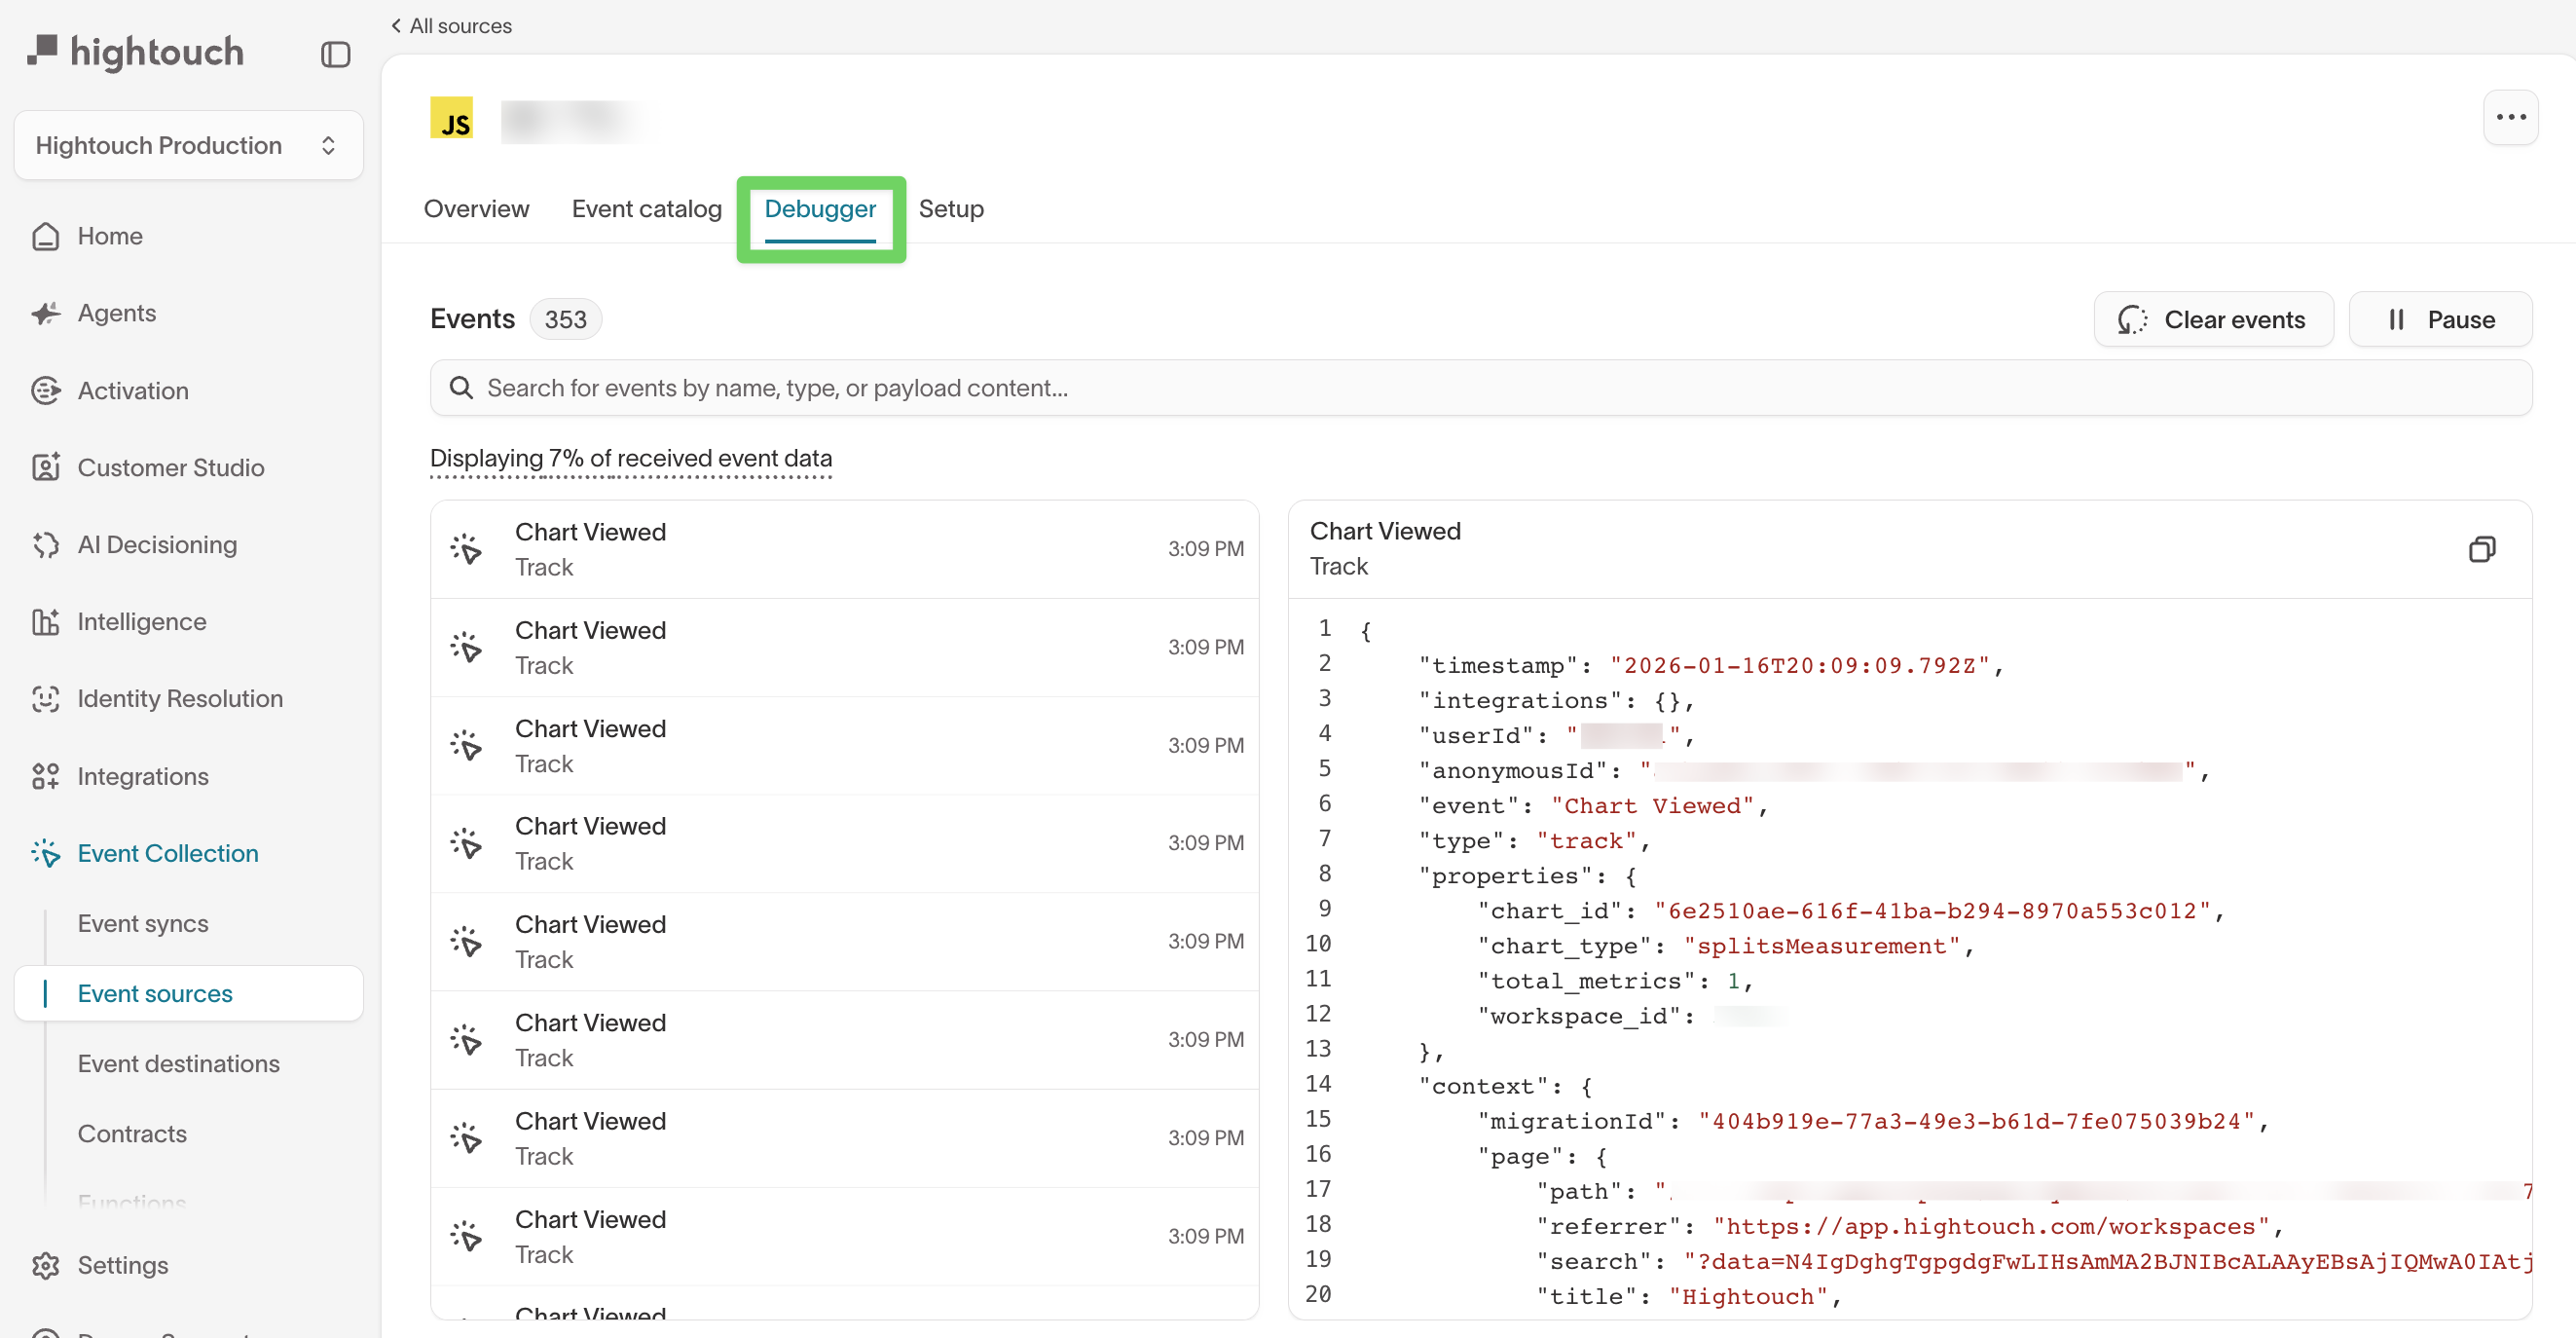
Debugger
The Debugger lets you inspect individual events as they arrive from the source.
From the debugger, you can:
- View recently received events and timestamps
- Search events by name, type, or payload content
- Inspect the full JSON payload for a selected event
- Pause or clear the event stream during debugging
The debugger is especially useful during:
- Initial SDK or API setup
- Instrumentation changes
- Troubleshooting missing or malformed events
If no events appear, confirm that the SDK or integration is installed correctly and that the source is actively sending data.
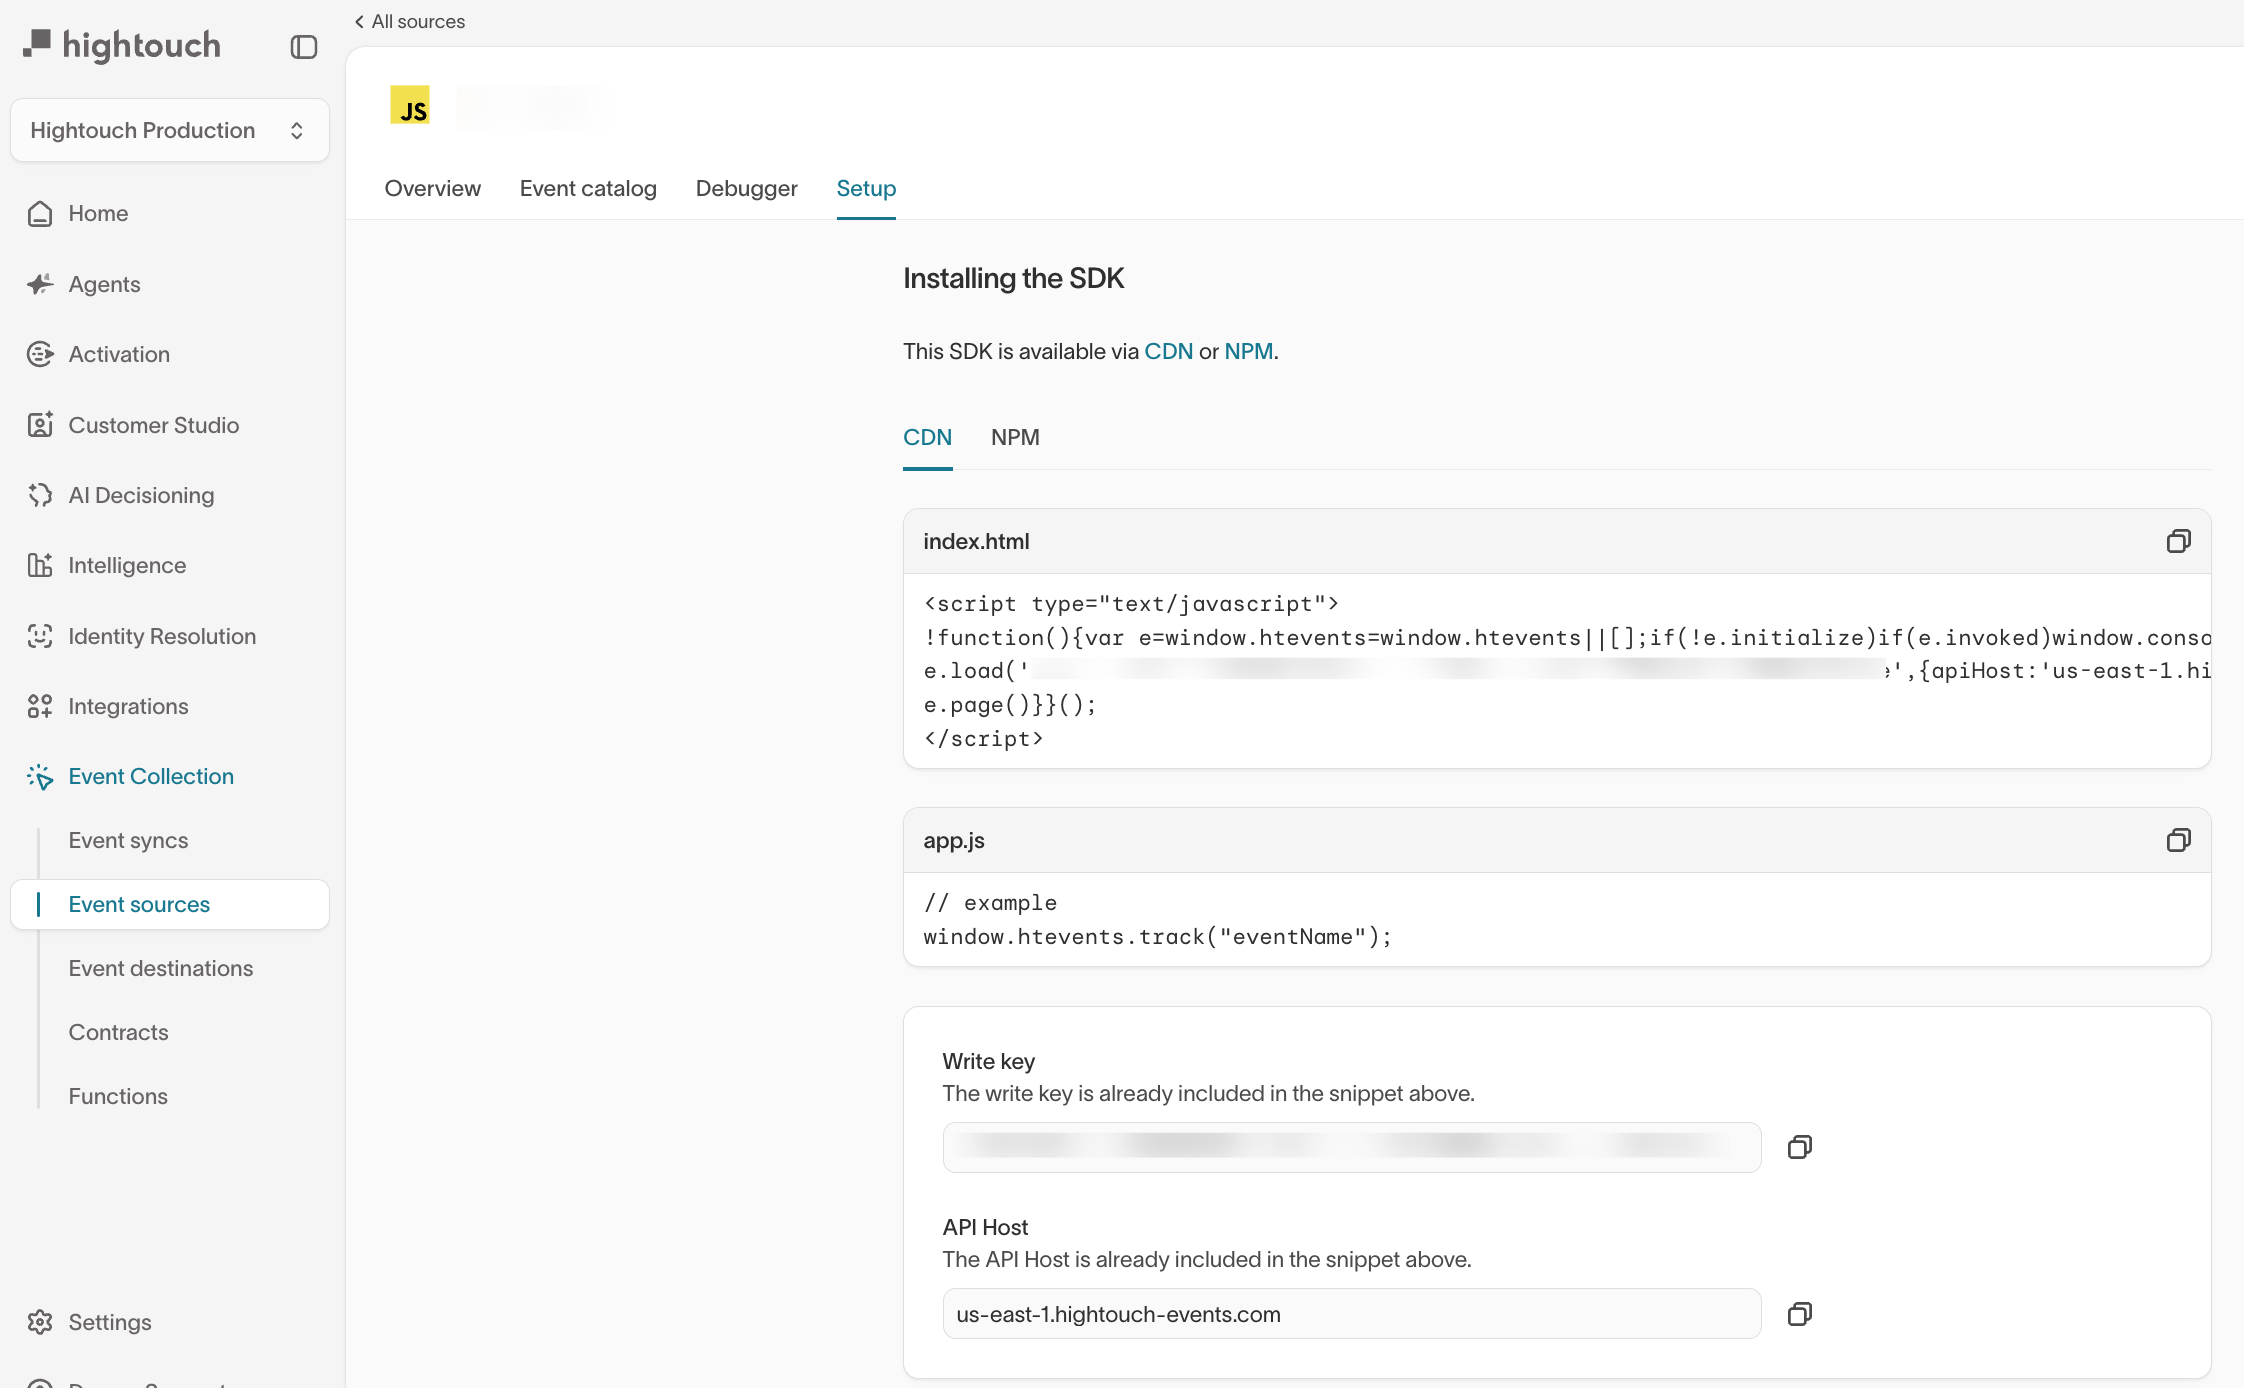
Setup
Use the Setup tab to install and configure the SDK or integration for this event source. This view provides source-specific installation instructions, including required keys, endpoints, and example code.
Next steps
- Send events to your warehouse once events are arriving
- Build your implementation — the full set of steps from collection through monitoring