Audience: Marketers and analysts
Prerequisites: Saved charts created from your schema models
Use dashboards to combine saved charts into a single, visual workspace where you can analyze trends, validate campaign logic, and monitor performance.
Overview
Dashboards let you organize saved charts in a flexible grid layout. You can use them to:
- Explore key metrics and user behavior
- Validate audience criteria before launching campaigns
- Monitor engagement, conversions, and lift over time
Dashboards are composed of saved Charts. Each chart is a data visualization created from your models (users, events, and related models). Charts can be reused across dashboards.
Who uses it
| Role | Responsibilities |
|---|---|
| Data, Marketing Ops or MarTech teams | Add and configure charts and dashboards |
| Marketers | Explore and filter dashboards |
Create a dashboard
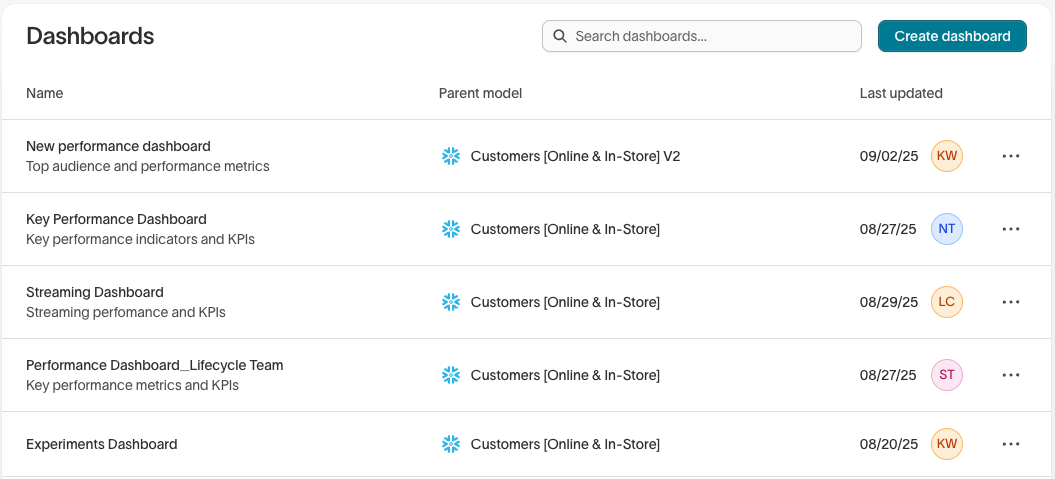
Step 1: Open the Dashboards tab
- Go to
Intelligence → Dashboardsto see all dashboards in your workspace. - Click
Create dashboardin the top right.
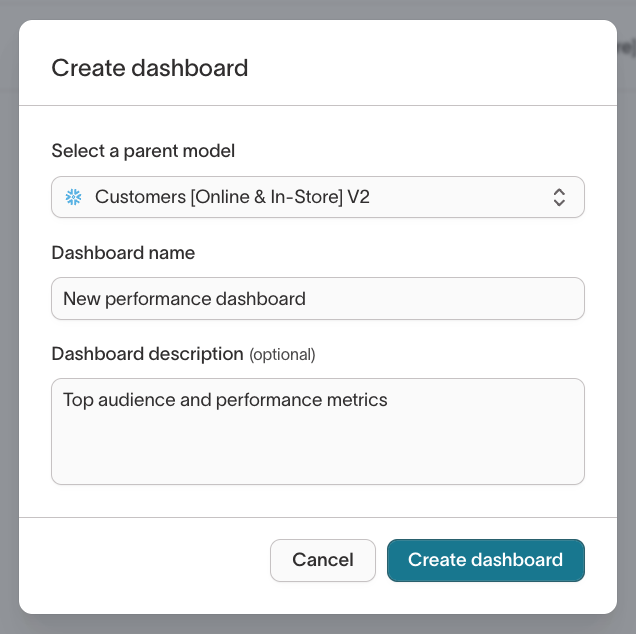
Step 2: Name your dashboard and choose a parent model
In the modal:
- Select a parent model (e.g. Users).
- Enter a dashboard name.
- Optionally, add a description.
- Click
Create dashboardto save and open your new dashboard.
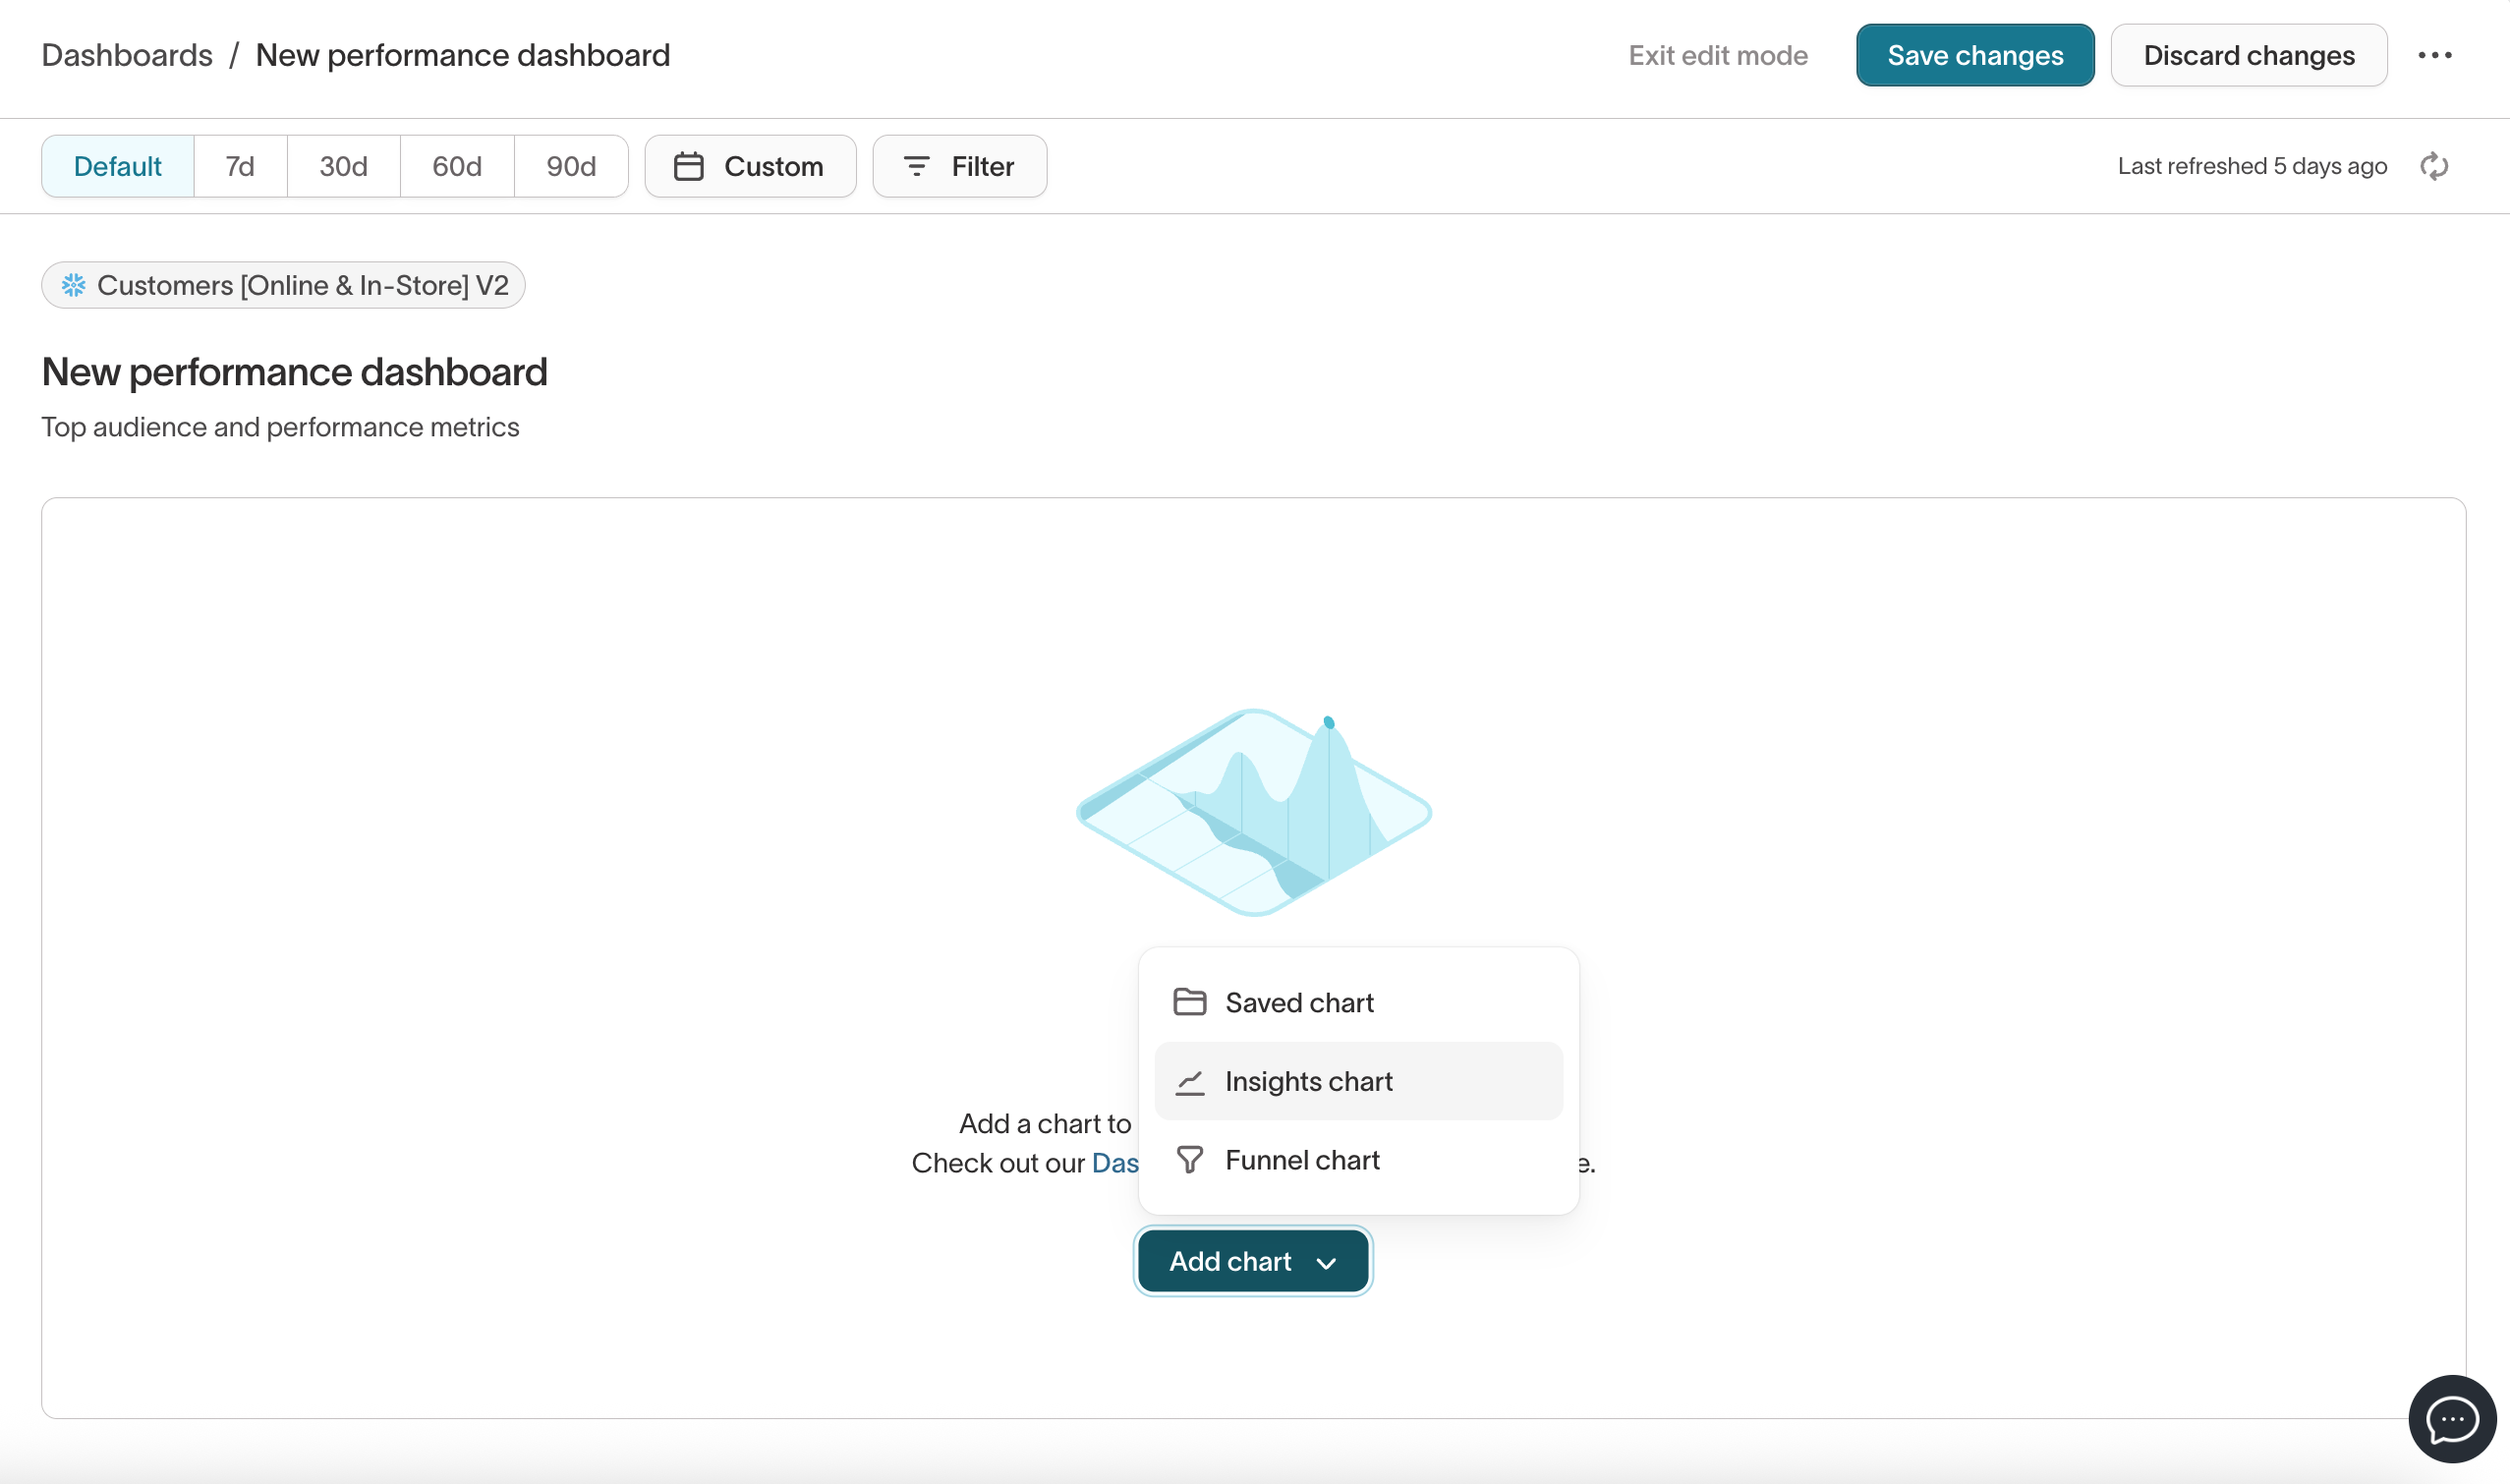
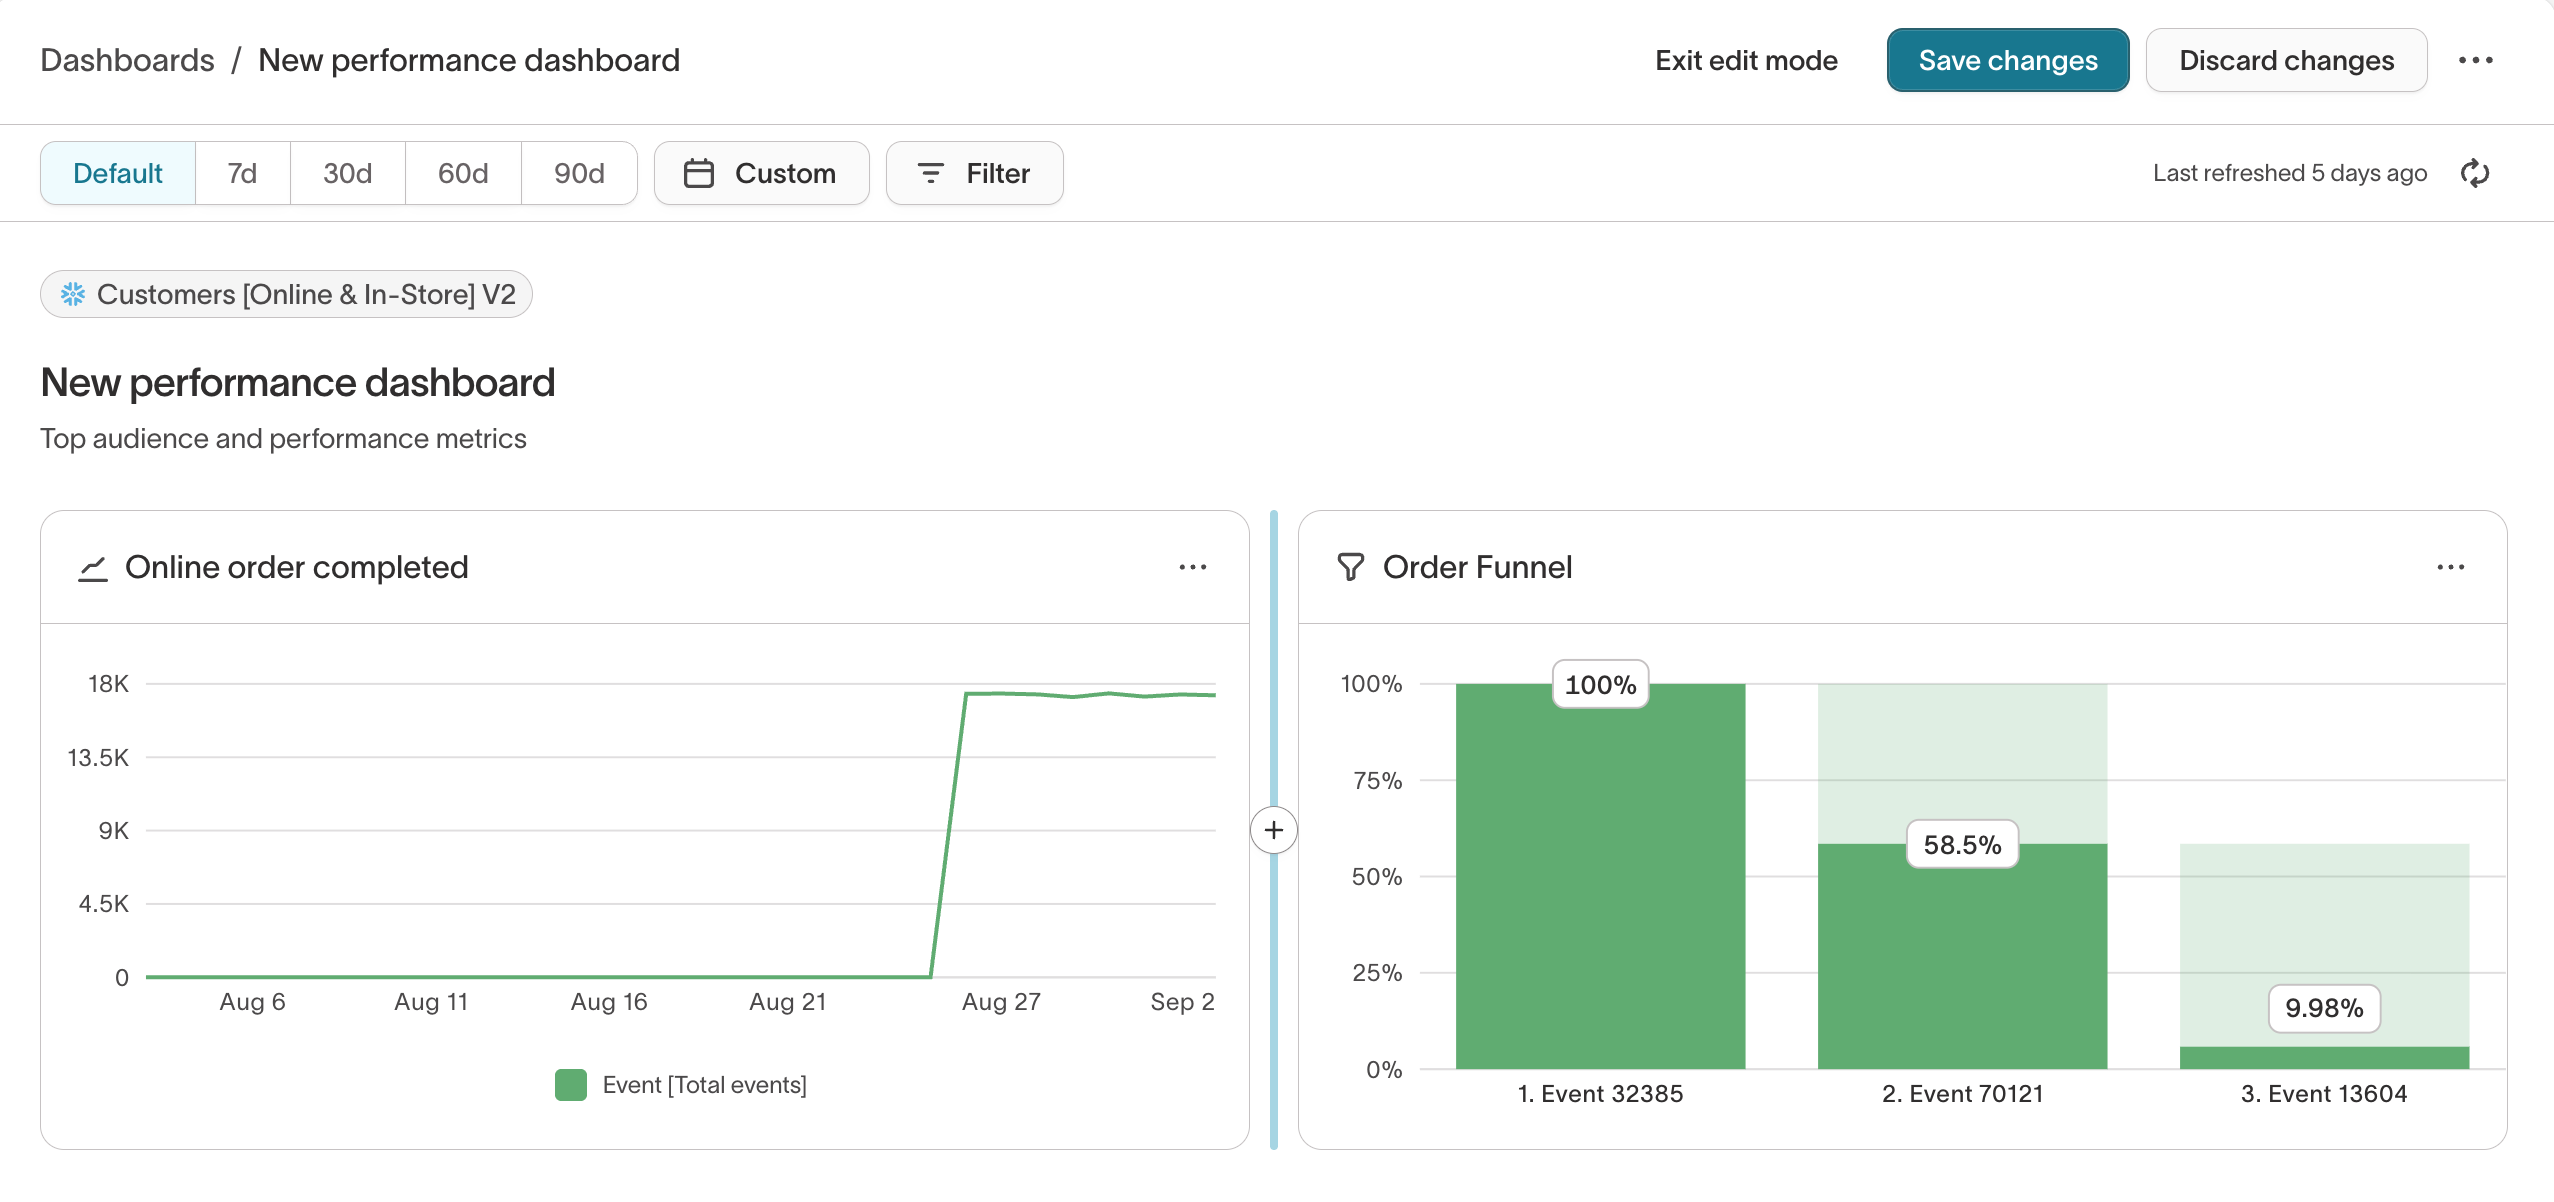
Step 3: Add charts
Click Add chart to choose one of the following options:
-
Saved chart: Add an existing chart from your library
-
Insights chart: Build a new visualization to measure your marketing efforts
-
Funnel chart: Track drop-off across a multi-step flow
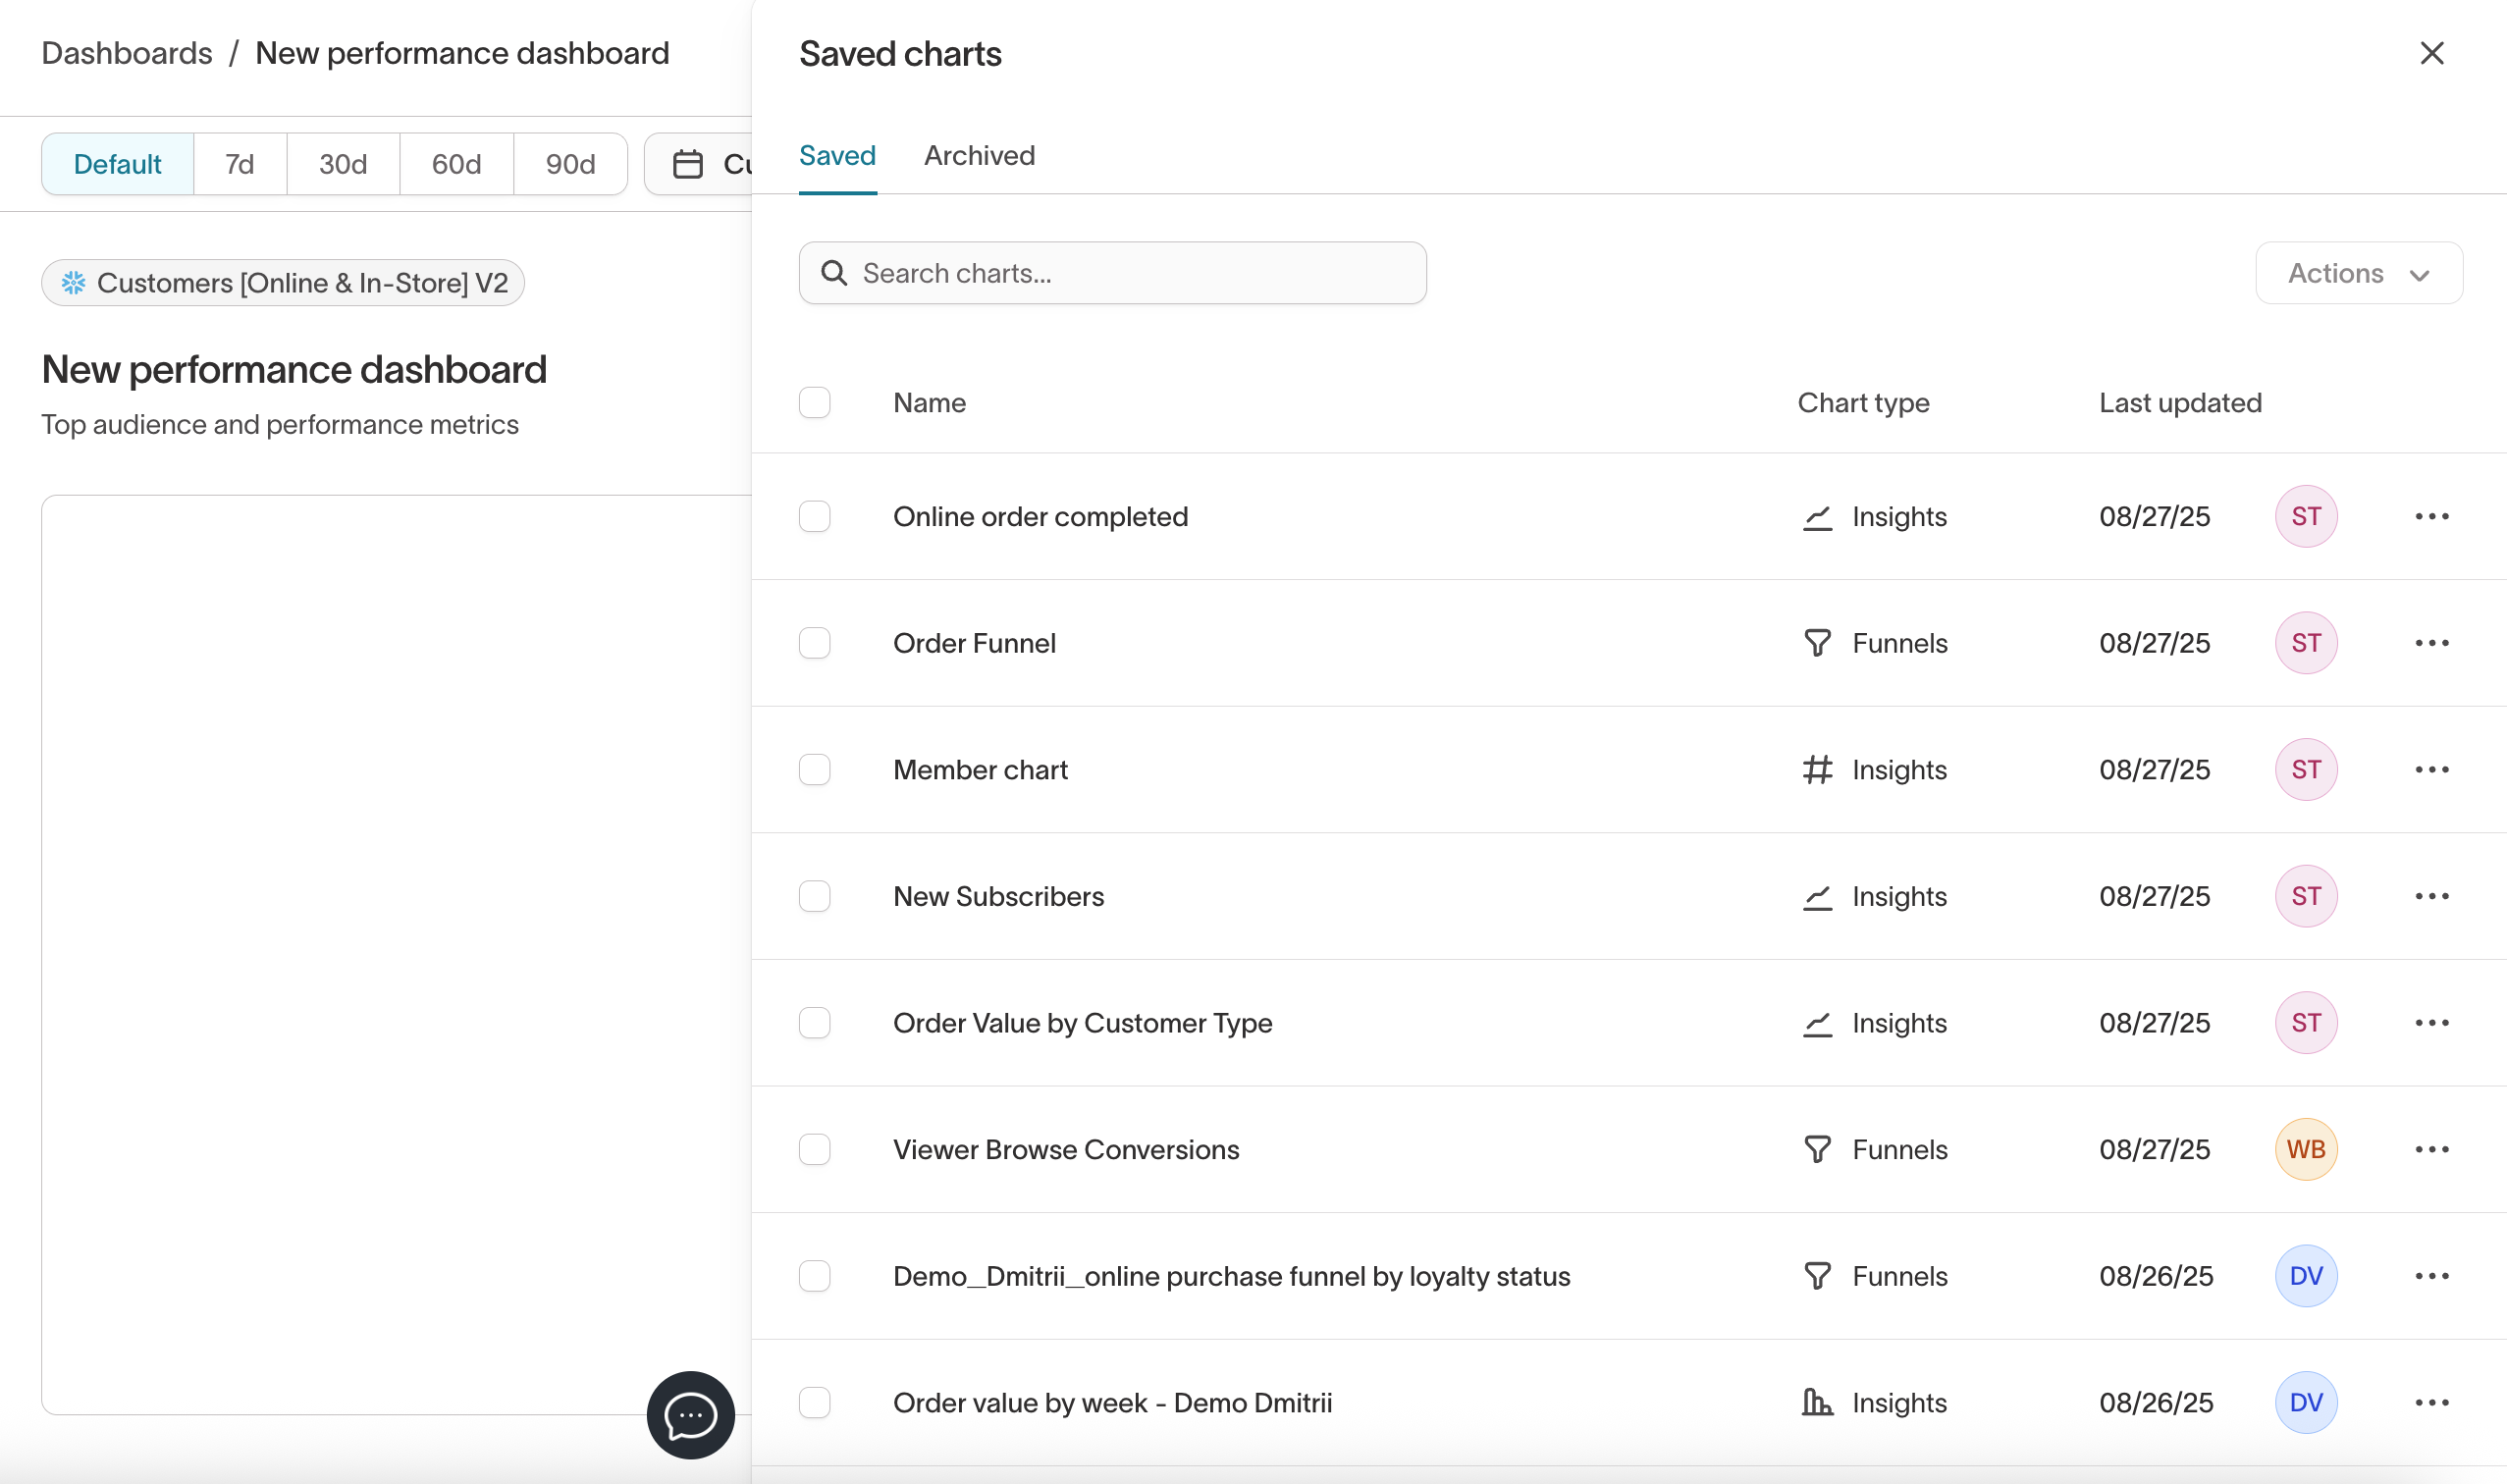
After adding charts, use drag-and-drop to arrange and resize them in your layout. Additional charts can be added within the same row or a new row, unless the maximum number of 4 charts for the row has been reached.
Archived charts will still appear on existing dashboards, but can't be added to new dashboards.
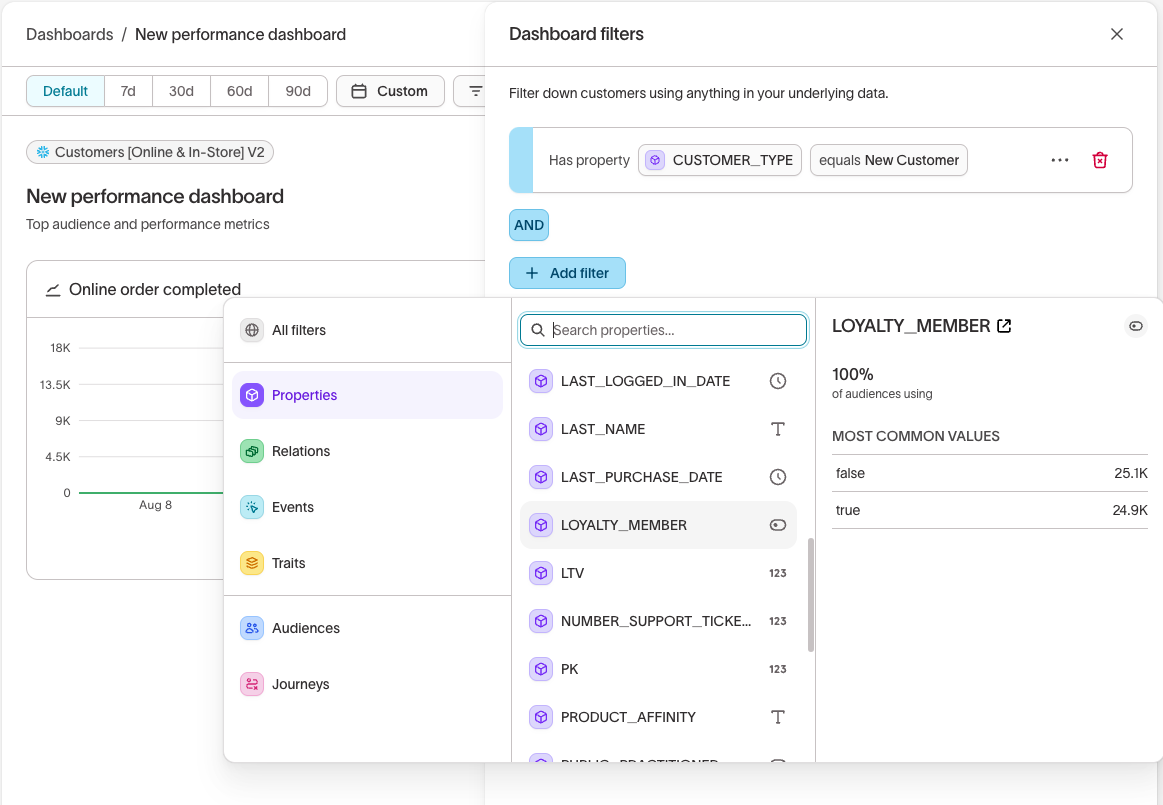
Apply filters
Use the filter bar at the top of the dashboard to apply filters across all charts. You can filter by:
- Time range: Default (respects the time filters on the individual charts), 7d, 30d, 60d, 90d, or set a custom range.
- Properties: Parent, event, and related model fields like
country,device_type. - Audience membership: One or multiple audiences can be applied to the dashboard.
Filters help you explore performance across specific timeframes, properties, or user segments.
Filters applied in View mode are temporary. Switch to Edit mode and click Save changes to make them permanent.
Edit and manage dashboards
Modes and editing
Dashboards support two modes:
| Mode | Description |
|---|---|
| Edit | Add, remove, or resize charts. Update filters and layout. |
| View | Explore charts and apply temporary filters. No changes saved. |
To save layout or filter changes, switch to Edit mode and click Save changes.
Manual refresh and data retention
-
Dashboard data is cached for up to 30 days
-
Each dashboard displays a
Last refreshedtimestamp -
Click the refresh button to manually reload chart data. New filters are not automatically applied, you must refresh the dashboard to apply them.
Scheduled refresh
You can also schedule dashboard refreshes so data is automatically loaded the next time you open the dashboard. The following options are available:
- Manual: The dashboard can only be refreshed manually.
- Custom recurrence: The dashboard refreshes at a specific time and schedule (for example, every Monday at 9:00 AM).
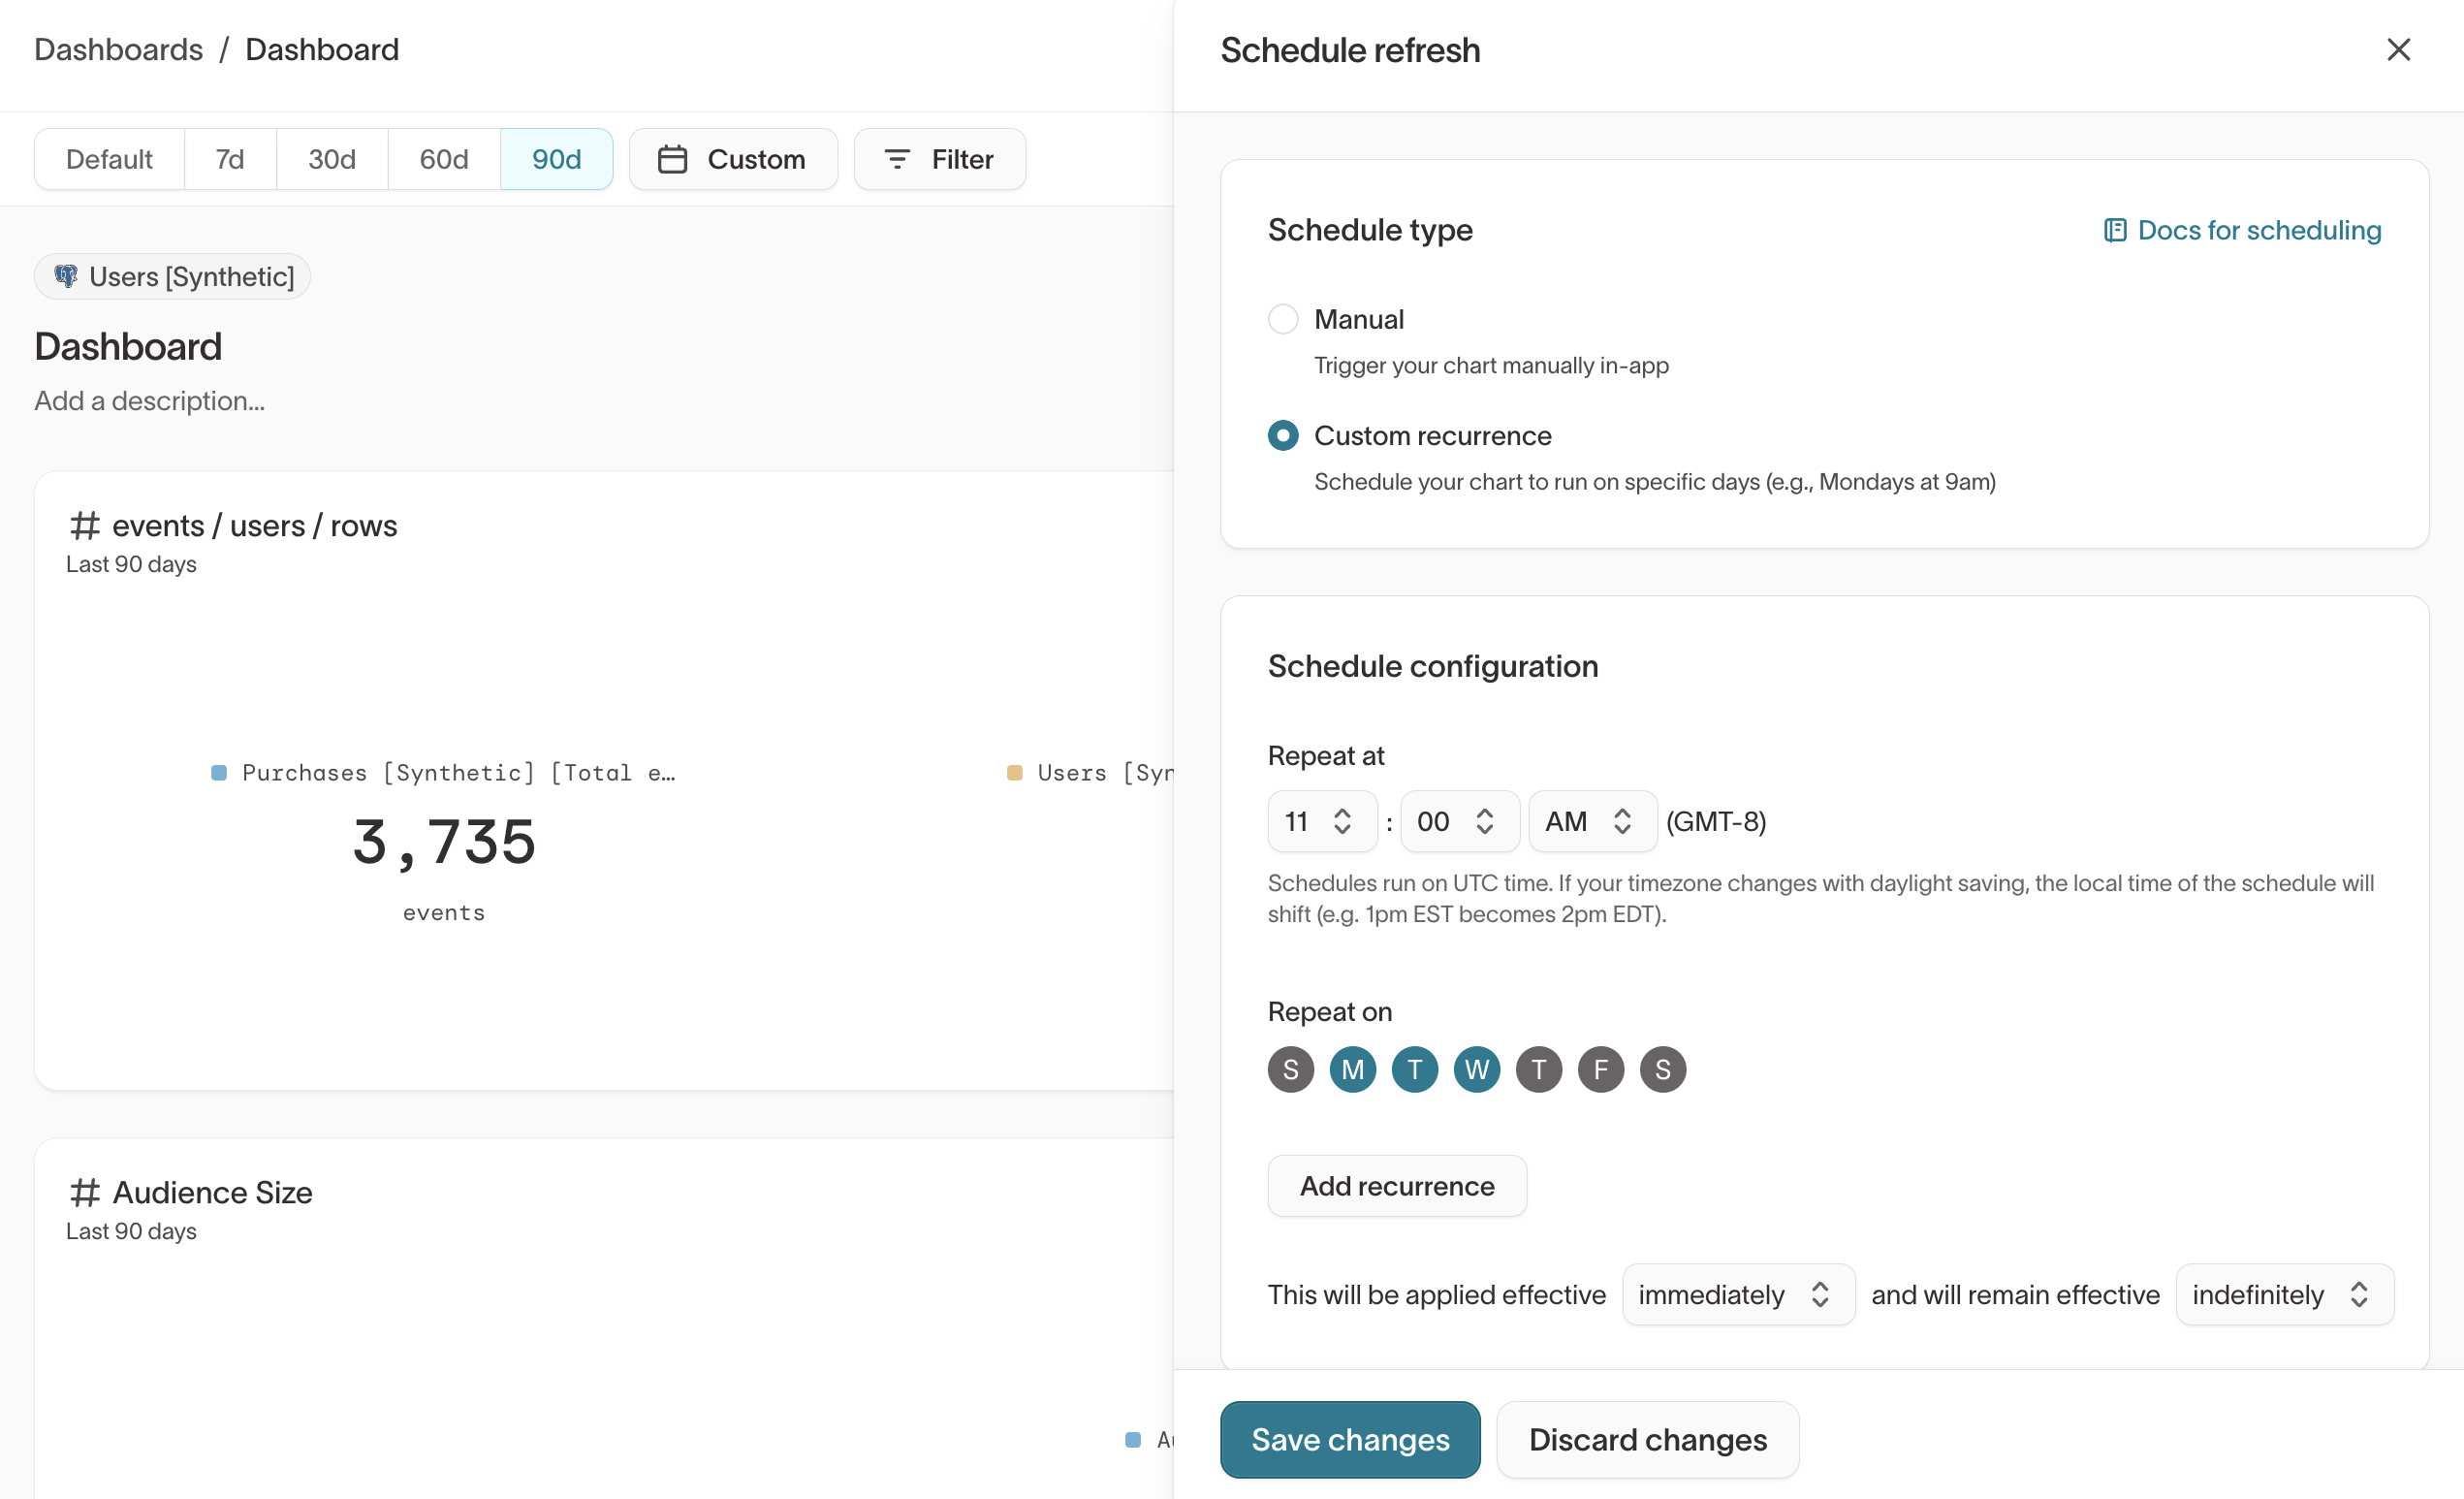
Chart behavior
If a saved chart is updated or removed after being added to a dashboard:
| Saved chart status | Behavior in dashboard |
|---|---|
| Deleted | A deleted chart placeholder appears |
| Updated | A warning is displayed. Changes appear only after the dashboard is refreshed |
| Archived | An archived badge appears until removed or restored |
Sharing dashboards
Dashboards are visible to anyone in your workspace with access to the parent model and can be shared via link with other workspace members.
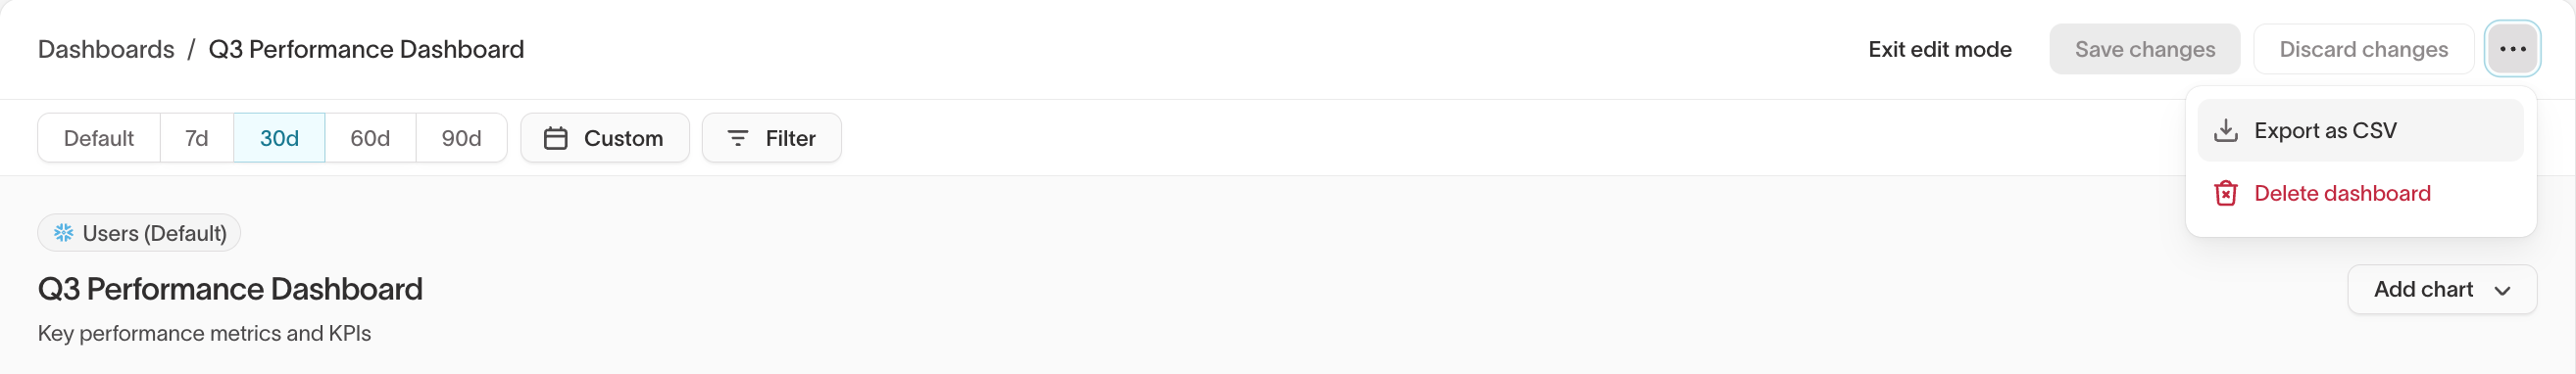
Exporting dashboards
The data displayed in the dashboard charts can be exported. The export generates a ZIP file containing a separate CSV for each individual chart in the dashboard.
Dashboard performance
-
Limit dashboards to 20 charts for optimal performance
-
If performance is a concern, consider leveraging sampling (fast queries). If enabled, it applies to the entire dashboard, not individual charts. Sampling could impact the accuracy of certain charts.
Example: Campaigns performance dashboard
Goal: Monitor engagement and conversions for Q3 promo campaigns
-
Create a saved chart for audience size over time
-
Create a dashboard named Q3 campaigns monitoring
-
Add:
-
Saved audience size chart
-
Build a chart for "Email delivered"
-
Build a chart for "Checkouts" in-line
-
-
Apply a Last 30 Days global filter
-
Refresh as needed to monitor performance throughout the campaign