Overview
Hightouch integrates with Datadog to help you gain greater observability into your syncs and monitor their health. Once you've authorized access to Datadog in Hightouch, we send real-time sync metrics and events to your Datadog account. You can then aggregate these statistics to gain insight into the health of your syncs.
Setup
You need your Datadog site and API key to set up the extension. You may want to create a new API key for Hightouch. Make sure that the API key creator in Datadog has the necessary write permissions for custom metrics (Metric Tags Write, Host Tags Write, Metrics Metadata Write) and events (Event Config Write).
Make sure to use the API Key itself and not the Key ID. Also ensure you use an API Key and not an Application Key to avoid the Datadog configuration is invalid error. You can find more information about the difference between these keys in Datadog's documentation.
- Go to the Monitoring section of the Extensions page and select Configure extension.
- Select your Datadog site and enter your API Key.
- Click Save.
Once you've saved your Datadog credentials in Hightouch, your syncs automatically start emitting metrics and events to Datadog.
Hightouch metrics and events don't immediately show up in Datadog, but only once sync runs are triggered.
Emitted metrics and events
Hightouch emits both metrics and events. Metrics are best suited for dashboards and statistical aggregations, while events are best for filtering. Don't hesitate to if there's another metric or event you're interested in using.
Metrics
hightouch.sync.row_processed
This metric is a COUNT type metric and is incremented for each row processed in the sync.
It provides the following tags:
sync- The sync slug in Hightouch.workspace- The slug of the Hightouch workspace that contains the sync.op(added/changed/removed) - The operation performed: whether the row was added, changed, or removed in the query.success(true/false) - Whether the row was successfully synced to the destination.
hightouch.sync.complete
This metric is a COUNT type metric and is incremented each time the sync completes.
It supports the following tags:
sync- The sync slug in Hightouch.workspace- The slug of the Hightouch workspace that contains the sync.status(success/failed/warning/cancelled) - The overall status of the sync run.
hightouch.sync.query_time
This metric tracks your syncs' querying times.
It supports the following tags:
sync- The sync slug in Hightouch.workspace- The slug of the Hightouch workspace that contains the sync.
hightouch.sync.execution_time
This metric tracks your syncs' execution times.
It supports the following tags:
sync- The sync slug in Hightouch.workspace- The slug of the Hightouch workspace that contains the sync.
hightouch.sync.total_time
This metric tracks your syncs' total run times.
It supports the following tags:
sync- The sync slug in Hightouch.workspace- The slug of the Hightouch workspace that contains the sync.
Events
hightouch.sync.complete
Hightouch emits this event each time a sync completes. It's identical to the metric of the same name.
It supports the following tags:
sync- The sync slug in Hightouch.workspace- The slug of the Hightouch workspace that contains the sync.status(success/failed/warning/canceled) - The overall status of the sync run.
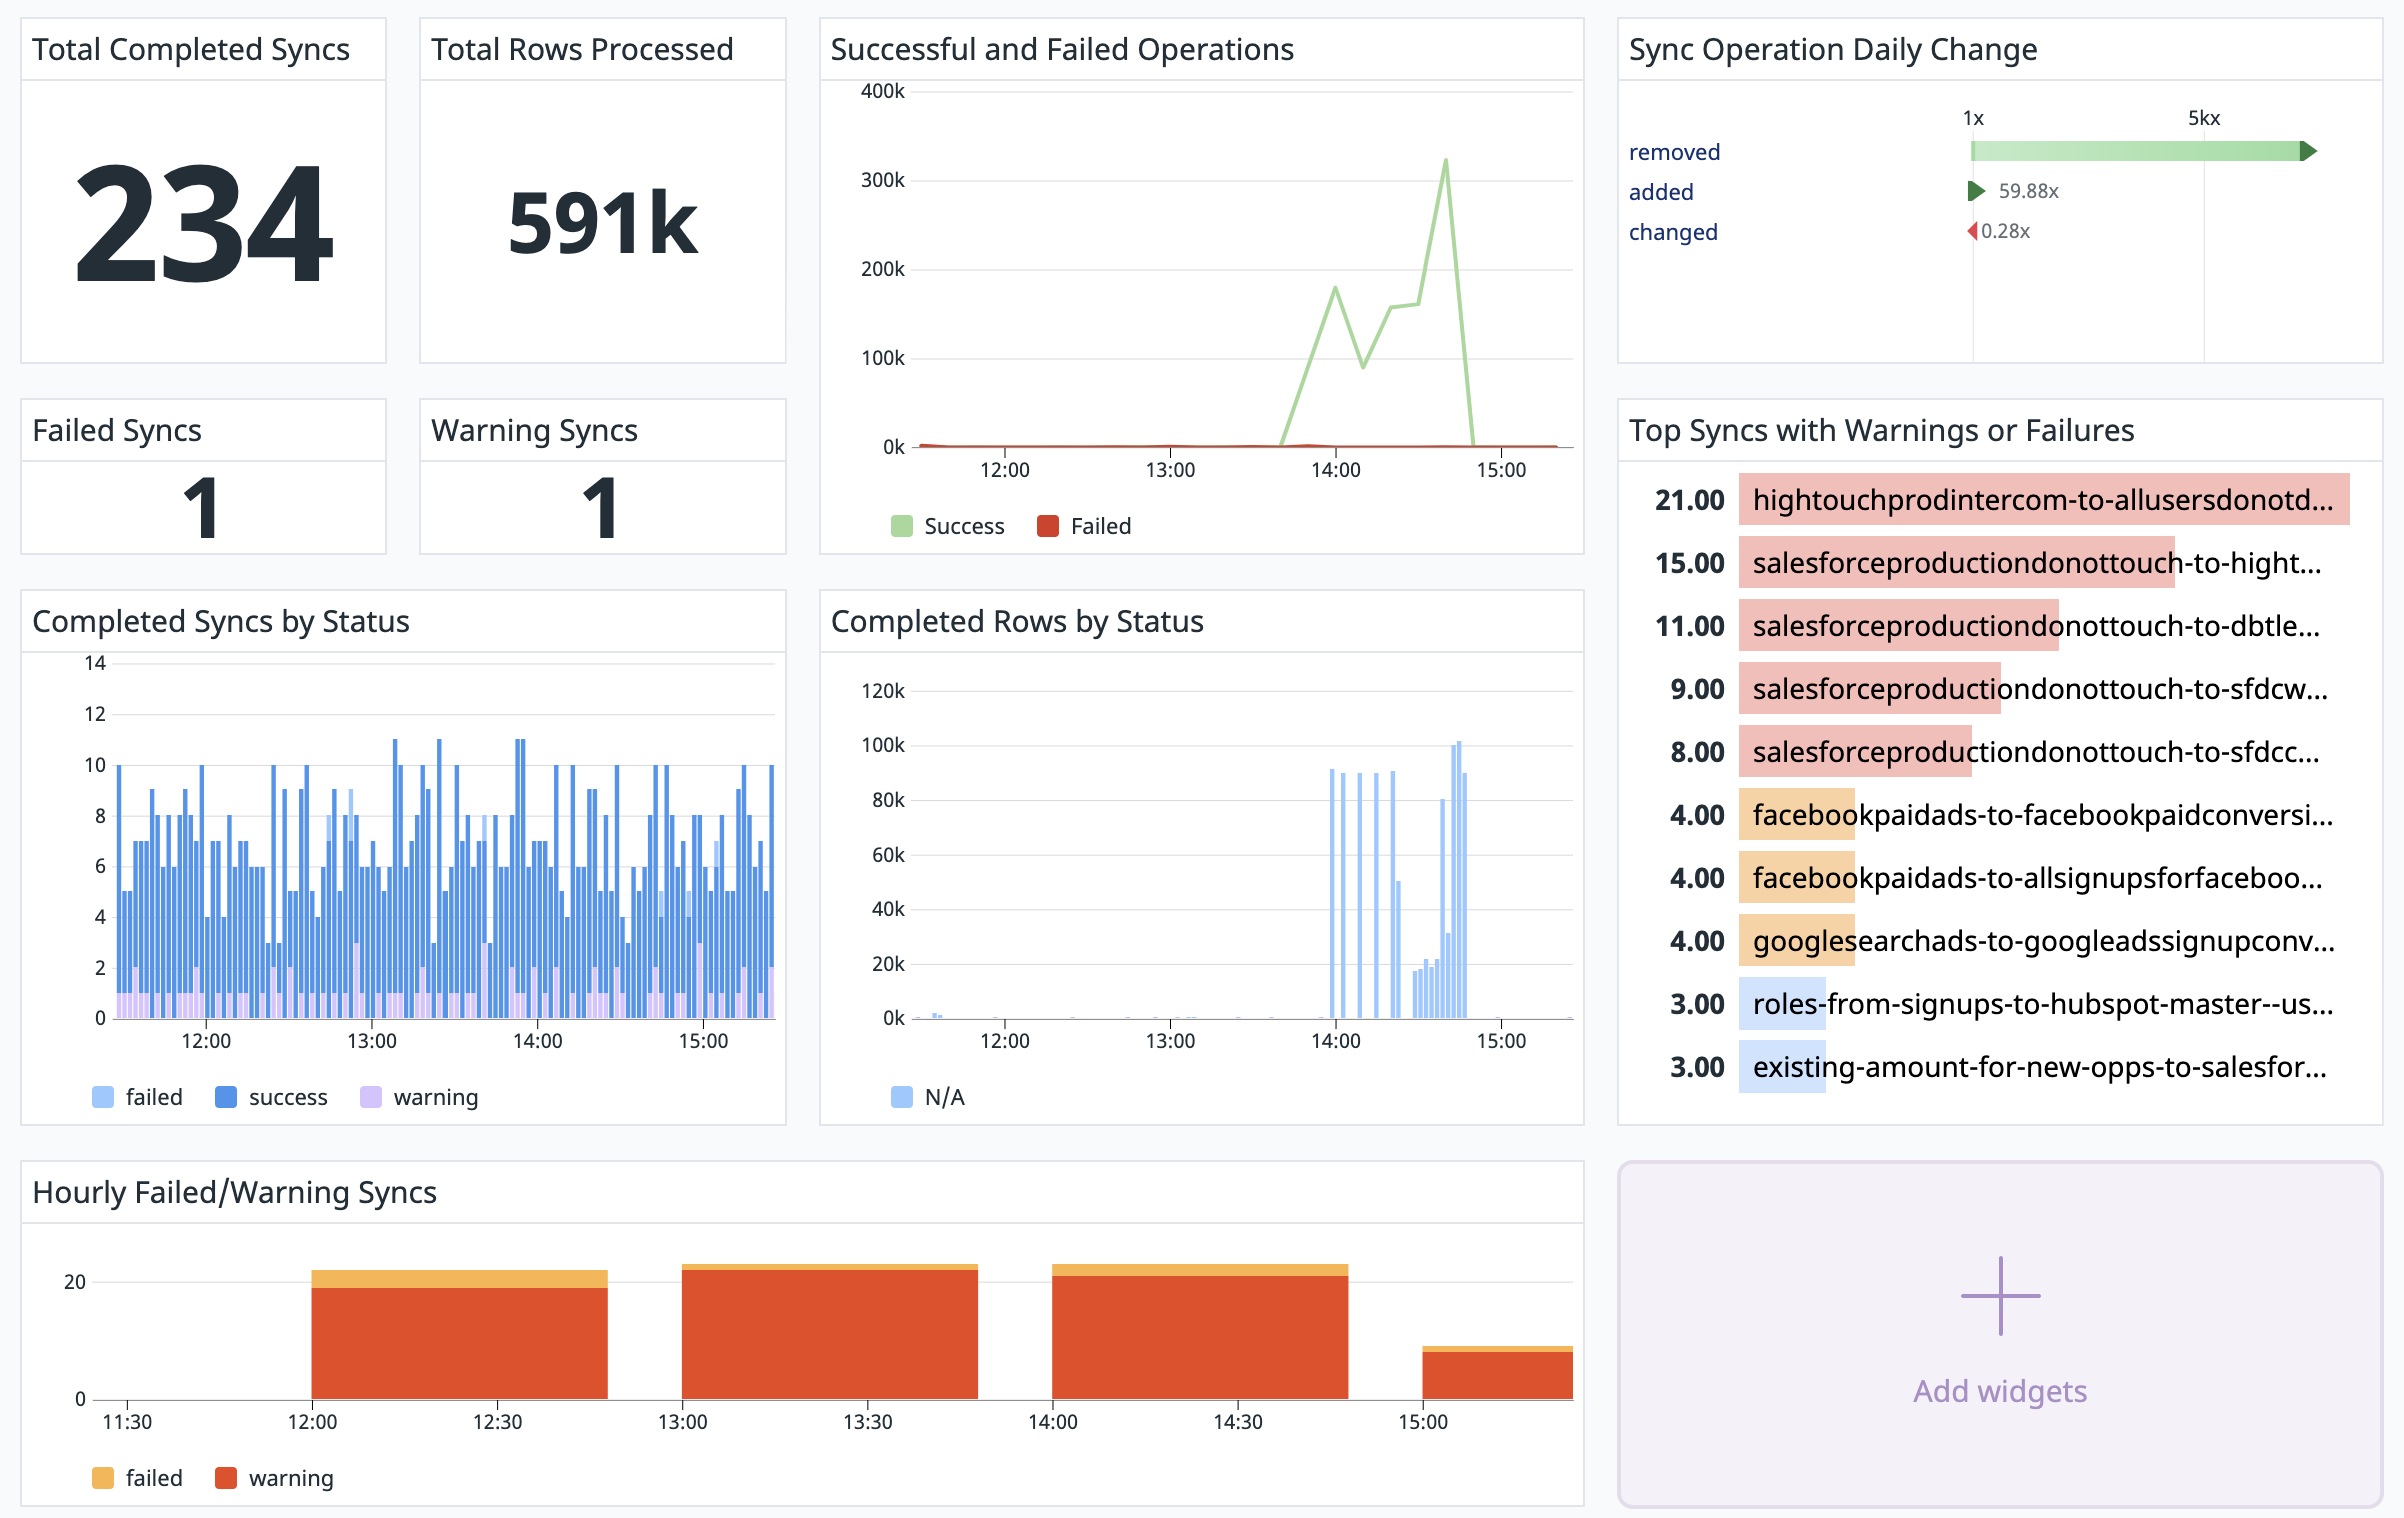
Use cases
With just a few metrics, you can build complex dashboards and monitors. For example, you can create dashboards that target specific syncs that are critical to your operations and report the total number of operations or top syncs that have warnings or failures.
You can import the JSON for a basic dashboard using this sample code to get started.
Completed sync status
One common use case is to build a basic dashboard that tracks completed syncs by status over time.
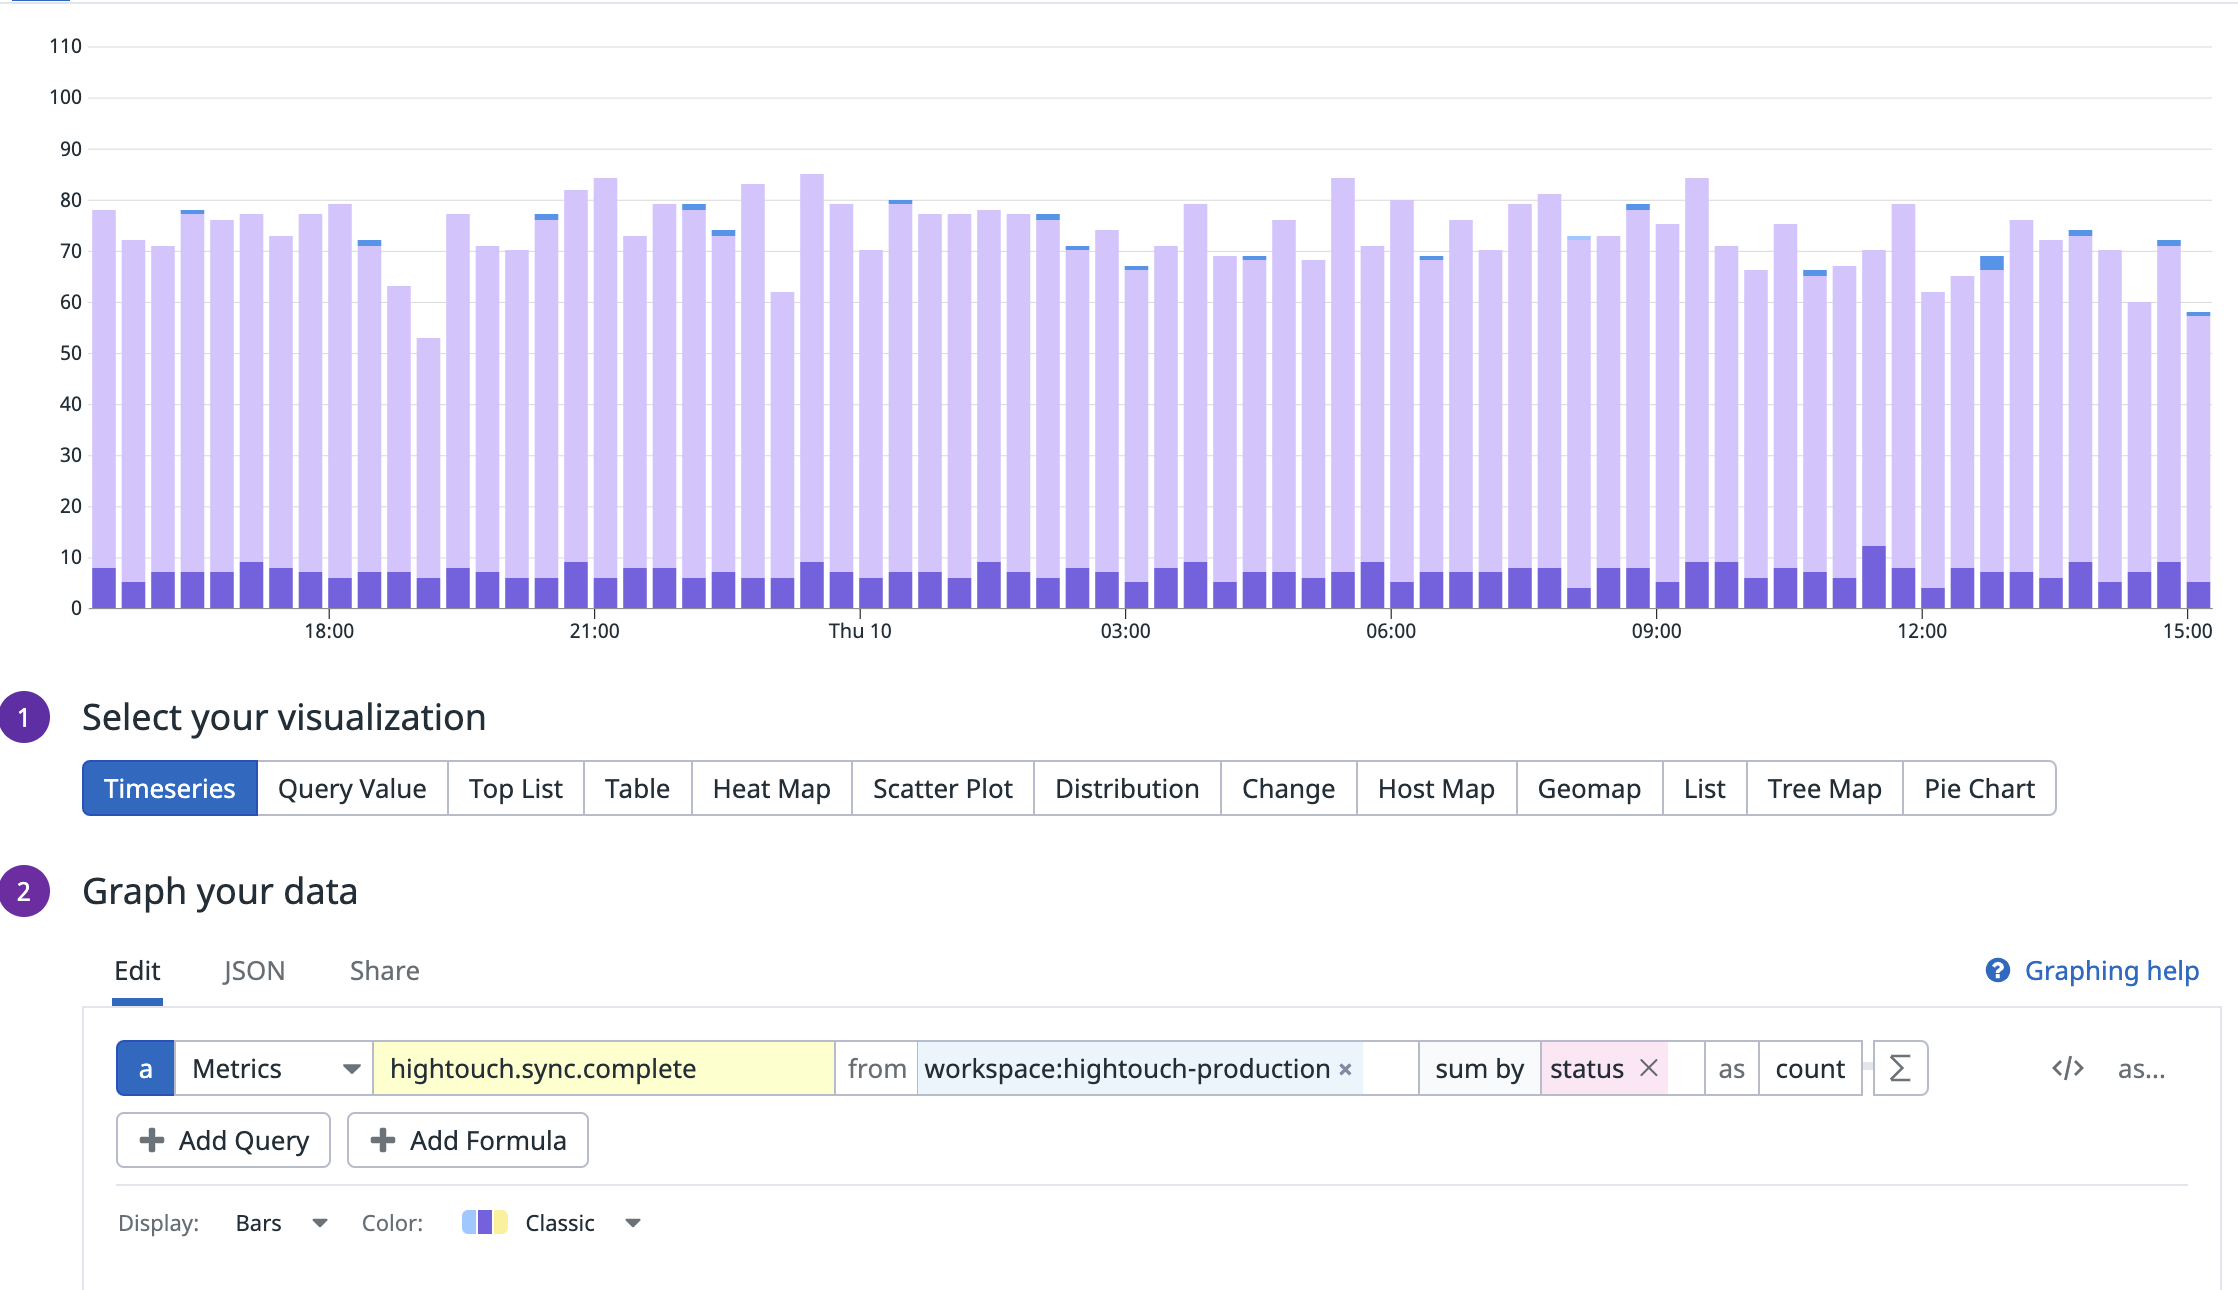
The preceding chart uses the hightouch.sync.complete metric and sums the counts by status. You can filter further by including only statuses that are status:success or NOT status:success.
Anomaly detection
Anomaly detection can help flag significant changes, like many users suddenly being deleted or created. You can use the Datadog extension for anomaly detection in added, changed, or removed rows.
Anomaly detection setup
- In Datadog, create a metric monitor with the Anomaly Detection method.
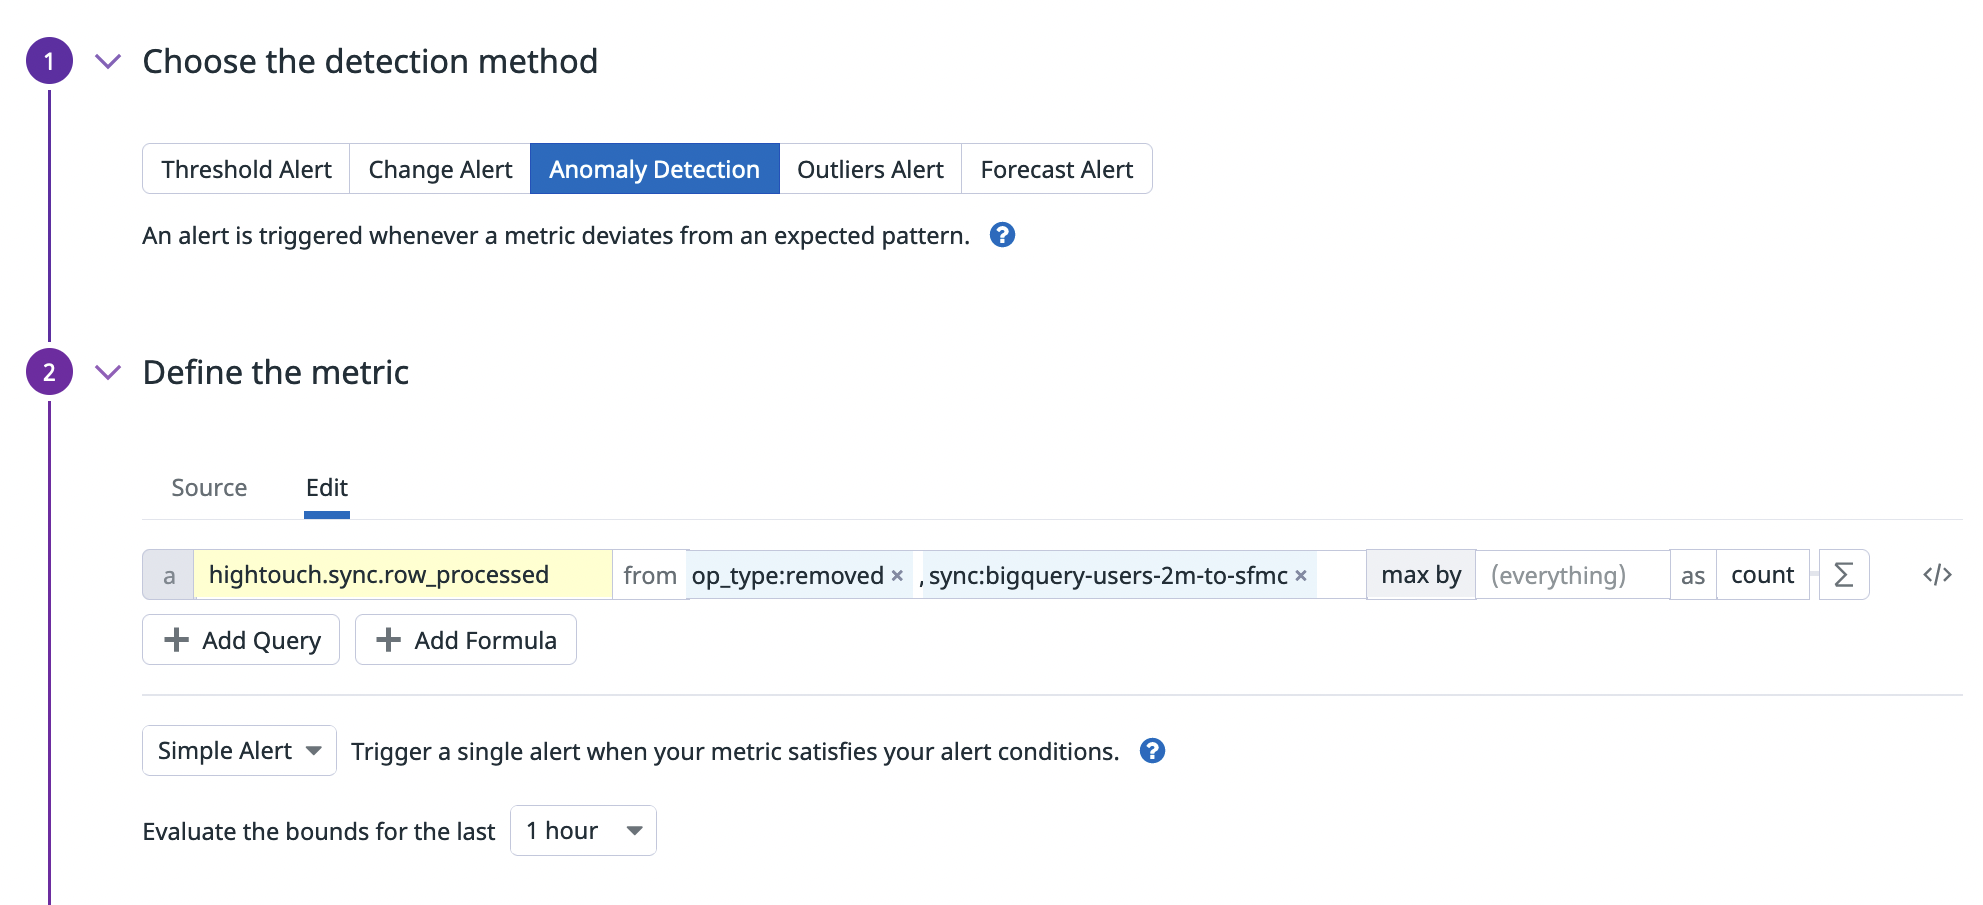
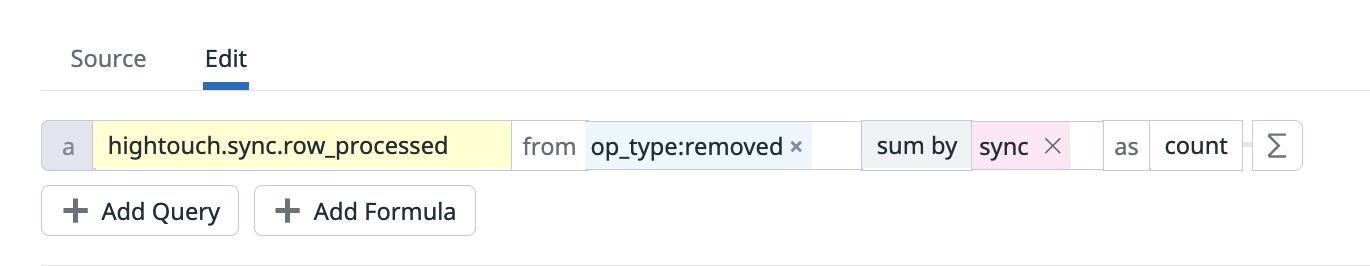
- Define the metric by selecting the
hightouch.sync.row_processedmetric. Specify theop_type, for example,removed, andsyncname. Select the metric aggregation assum byand entersync.
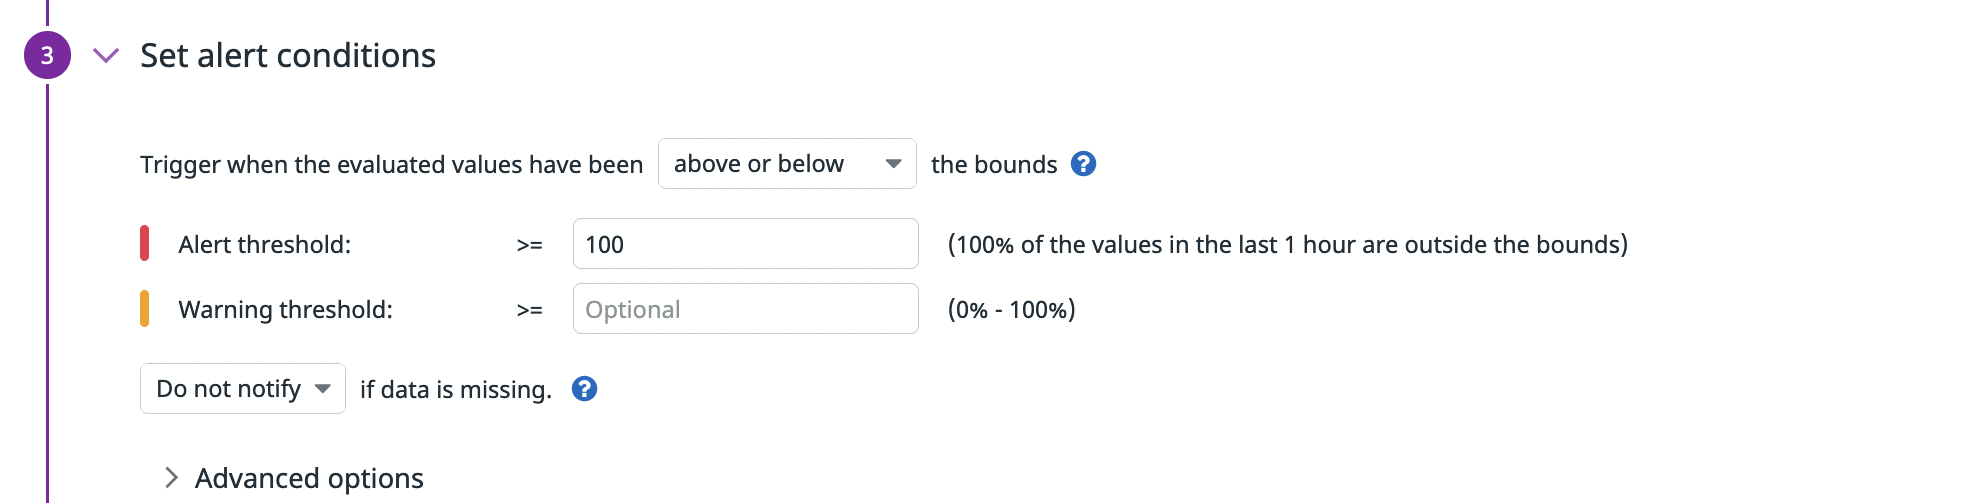
- In Alert Conditions, set the Alert threshold and Warning threshold to values that make sense for your use case.
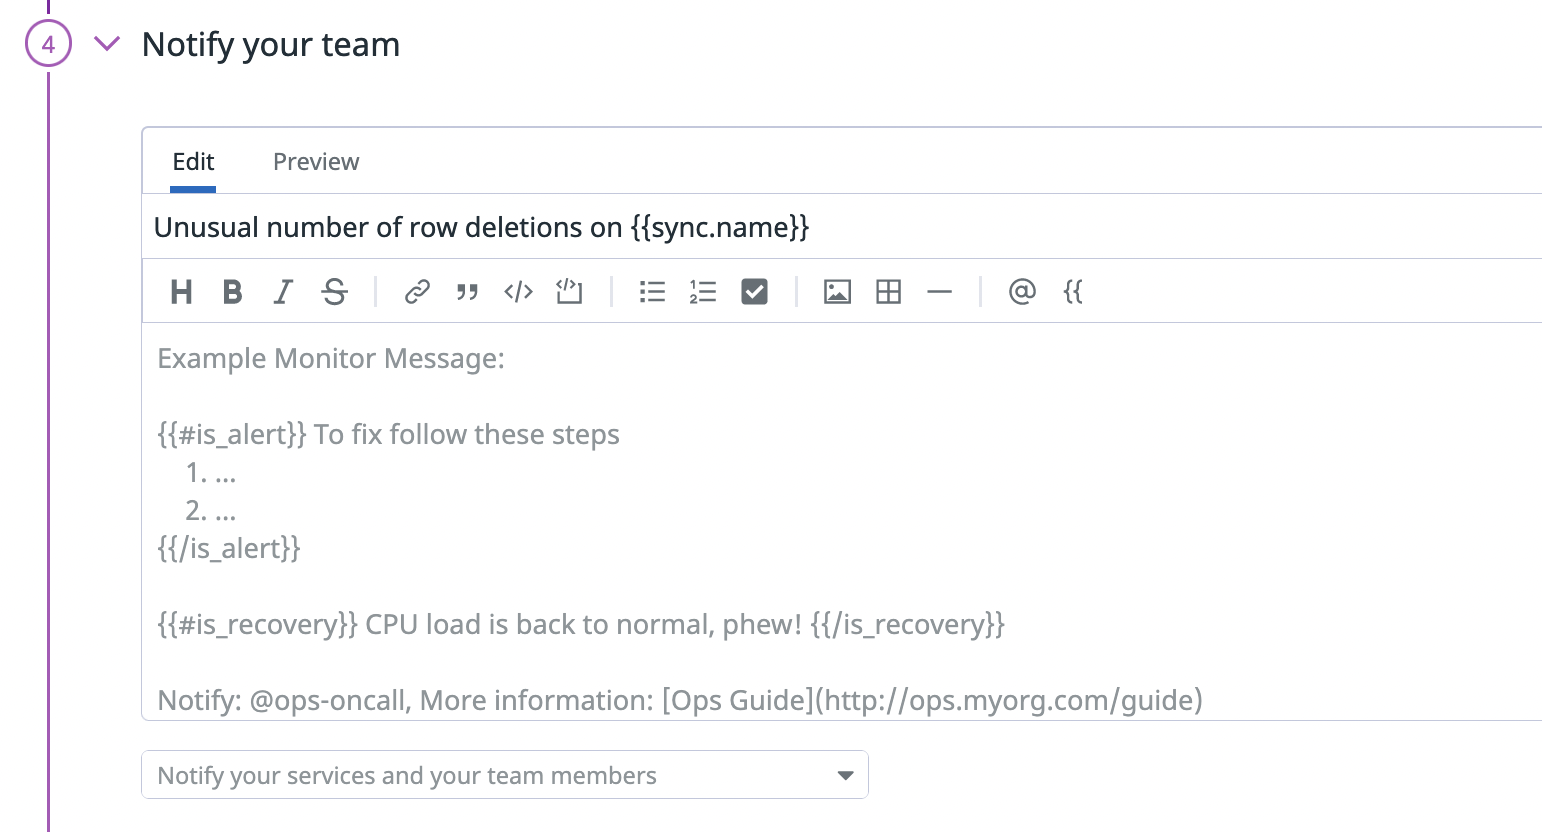
- (Optional) You can inject the sync name into the monitor's subject or message body using
{{sync.name}}.
Other use cases
You're not limited to the preceding examples. Here are some other use cases to consider:
- Metric monitors for when the number of failed rows exceeds a threshold
- Metric monitors for when a critical sync hasn't run over a specified time period