It's common to hear teams discuss the importance of "data-driven decision-making." Although this was once a lofty aspiration, innovations in the modern data stack, like data warehouses, data lakes, and Business Intelligence (BI) tools, have made it simpler and cheaper than ever to make sense of real-time data.
The rise of machine learning, artificial intelligence, and data mining has increased the value of data. There's an unsolved challenge though. Insights gathered from this data are only valuable once they're used to make a change in the business that shifts the needle forward. This is sometimes referred to as the "last mile of analytics."
Without that elusive last mile, analytics is, at best, a reactive report card for your business and, at worst, a waste of time. Hundreds of companies struggle with this challenge: all data lives in the data warehouse. It's easy to do reporting, but it's tough to take action on that data.
In short, the data warehouse (e.g., the tool that companies purchased to de-silo their data) has become a silo.
What is Operational Analytics
Operational Analytics shifts the focus from simply understanding data to taking action on it in the tools that run business processes. Instead of using dashboards to make decisions, Operational Analytics is focused on turning insights into action – automatically.
When all your data is stored in your data warehouse, it's only accessible to your technical users who know how to write SQL. Your business teams across sales, marketing, support, and product can't leverage this data in any meaningful way other than looking at it through a report.
Operational Analytics is a category of business analytics that's focused on syncing data from your warehouse directly to your business tools – thus ensuring that everyone across your organization has access to the same data regardless of their technical skills.
Operational Analytics vs. Traditional Analytics
Traditional Analytics is focused on collecting, transforming, and visualizing data to paint a complete picture of your business. This data is typically presented in a BI tool and shared in a dashboard on some set interval, whether it's weekly, monthly, or quarterly.
Traditional Analytics is all about providing high-level insights into specific KPIs to power strategic business decisions and everyday operations. On the other hand, Operational Analytics leverages data to actually "do things," like enriching Salesforce with relevant product usage data or triggering an email when a customer takes an action. Operational Analytics helps sync data between systems to communicate with users, bill customers, and alert employees.
Operational Analytics represents the actions you take with your data, and Traditional Analytics embodies the decisions you make with your data. The challenge is that Operational Analytics cannot exist without Traditional Analytics, and you need both to run a successful business.
The Challenge of Operational Analytics
The persistent challenge with operational data is that getting your various tools to "talk" to one another is not easy. You need to figure out how to get data to flow dependably and accurately between each pair of applications. Data integration tools like Fivetran have made it easy to move data into your warehouse, but moving data out of your warehouse is another challenge altogether. Every destination requires you to build another data pipeline and integrate with yet another third-party API.
Emails addressed to first_name showcase this notorious problem. Another challenge could be something as simple as syncing product usage data to your CRM or purchase data to an ad network, so you don't accidentally target customers with an ad for something they already purchased.
Many processes and tools have arisen over the years to tackle this challenge, but they all introduce their own complexities and fail to address the whole picture.
- Building home-grown data pipelines and writing custom code is expensive, time-consuming, and difficult to maintain at scale.
- Customer data platforms make you pay for a second layer of storage and they have almost no flexibility when it comes to modeling your data.
- Business Intelligence (BI) tools help you consume your data, but they don’t help your teams take action on your data consistently.
- Integration Platforms as a Service (iPaaS) and automation tools force you to build and maintain complex workflows and they introduce a point-to-point architecture that isn’t scalable.
The beauty of analytics data is that it's often the only realm where your different datasets live together harmoniously, which turns out to be the key to unlocking Operational Analytics. The data warehouse inevitably ends up being your single source of truth – making it the ideal analytics solution for digestible and contextual reporting powered by BI tools like Looker and Tableau.
Thanks to innovations in the data warehousing space and surrounding ecosystem, bringing data together for analytics has never been easier or more cost-effective. The problem is that dashboards are useful in decision-making, but they don't provide a tangible way for your business teams to act on that data.
Why is Operational Analytics Becoming so Popular?
It just so happens that what was previously thought of as the "analytics layer" turns out to be the perfect foundation for operational data workflows, and the antidote to the challenges associated with getting systems to "talk to" one another.
As opposed to creating point-to-point connections between tools, companies are now beginning to realize the data warehouse can be used for more than just analytics – it's becoming the "hub" for all operational data workflows (e.g., Operational Analytics.)
The warehouse as the hub for customer data
There are a few reasons why the "analytics layer" is the ideal hub for operational workflows:
-
It’s easier than ever to aggregate and integrate your data. Thanks to data integration tools like Fivetran, it’s super simple to consolidate your data into a warehouse. Your teams can now quickly bring all of your customer data across all of your sources into a fabled single view of your customer.
-
Data platforms offer robust security. Since you own your data warehouse, your data never has to leave your cloud environment and fall into the hands of another vendor. This means you don't have to worry about regulations around HIPPA or GDPR.
-
This approach also breaks down silos and establishes your data warehouse as the single source of truth across your entire business. By taking the transformed data from your warehouse and syncing it to your operational tools, your business teams no longer have to worry about where the data came from or how fresh it is.
The beauty of analytics data is that it's often the only realm where your different datasets live together harmoniously, which turns out to be the key to unlocking Operational Analytics. The data warehouse inevitably ends up being your single source of truth – making it the ideal analytics solution for digestible and contextual reporting powered by BI tools like Looker and Tableau.
Thanks to innovations in the data warehousing space and surrounding ecosystem, bringing data together for analytics has never been easier or more cost-effective. The problem is that dashboards are useful in decision-making, but they don't provide a tangible way for your business teams to act on that data.
Where Does Operational Analytics Fit in the Modern Data Stack?
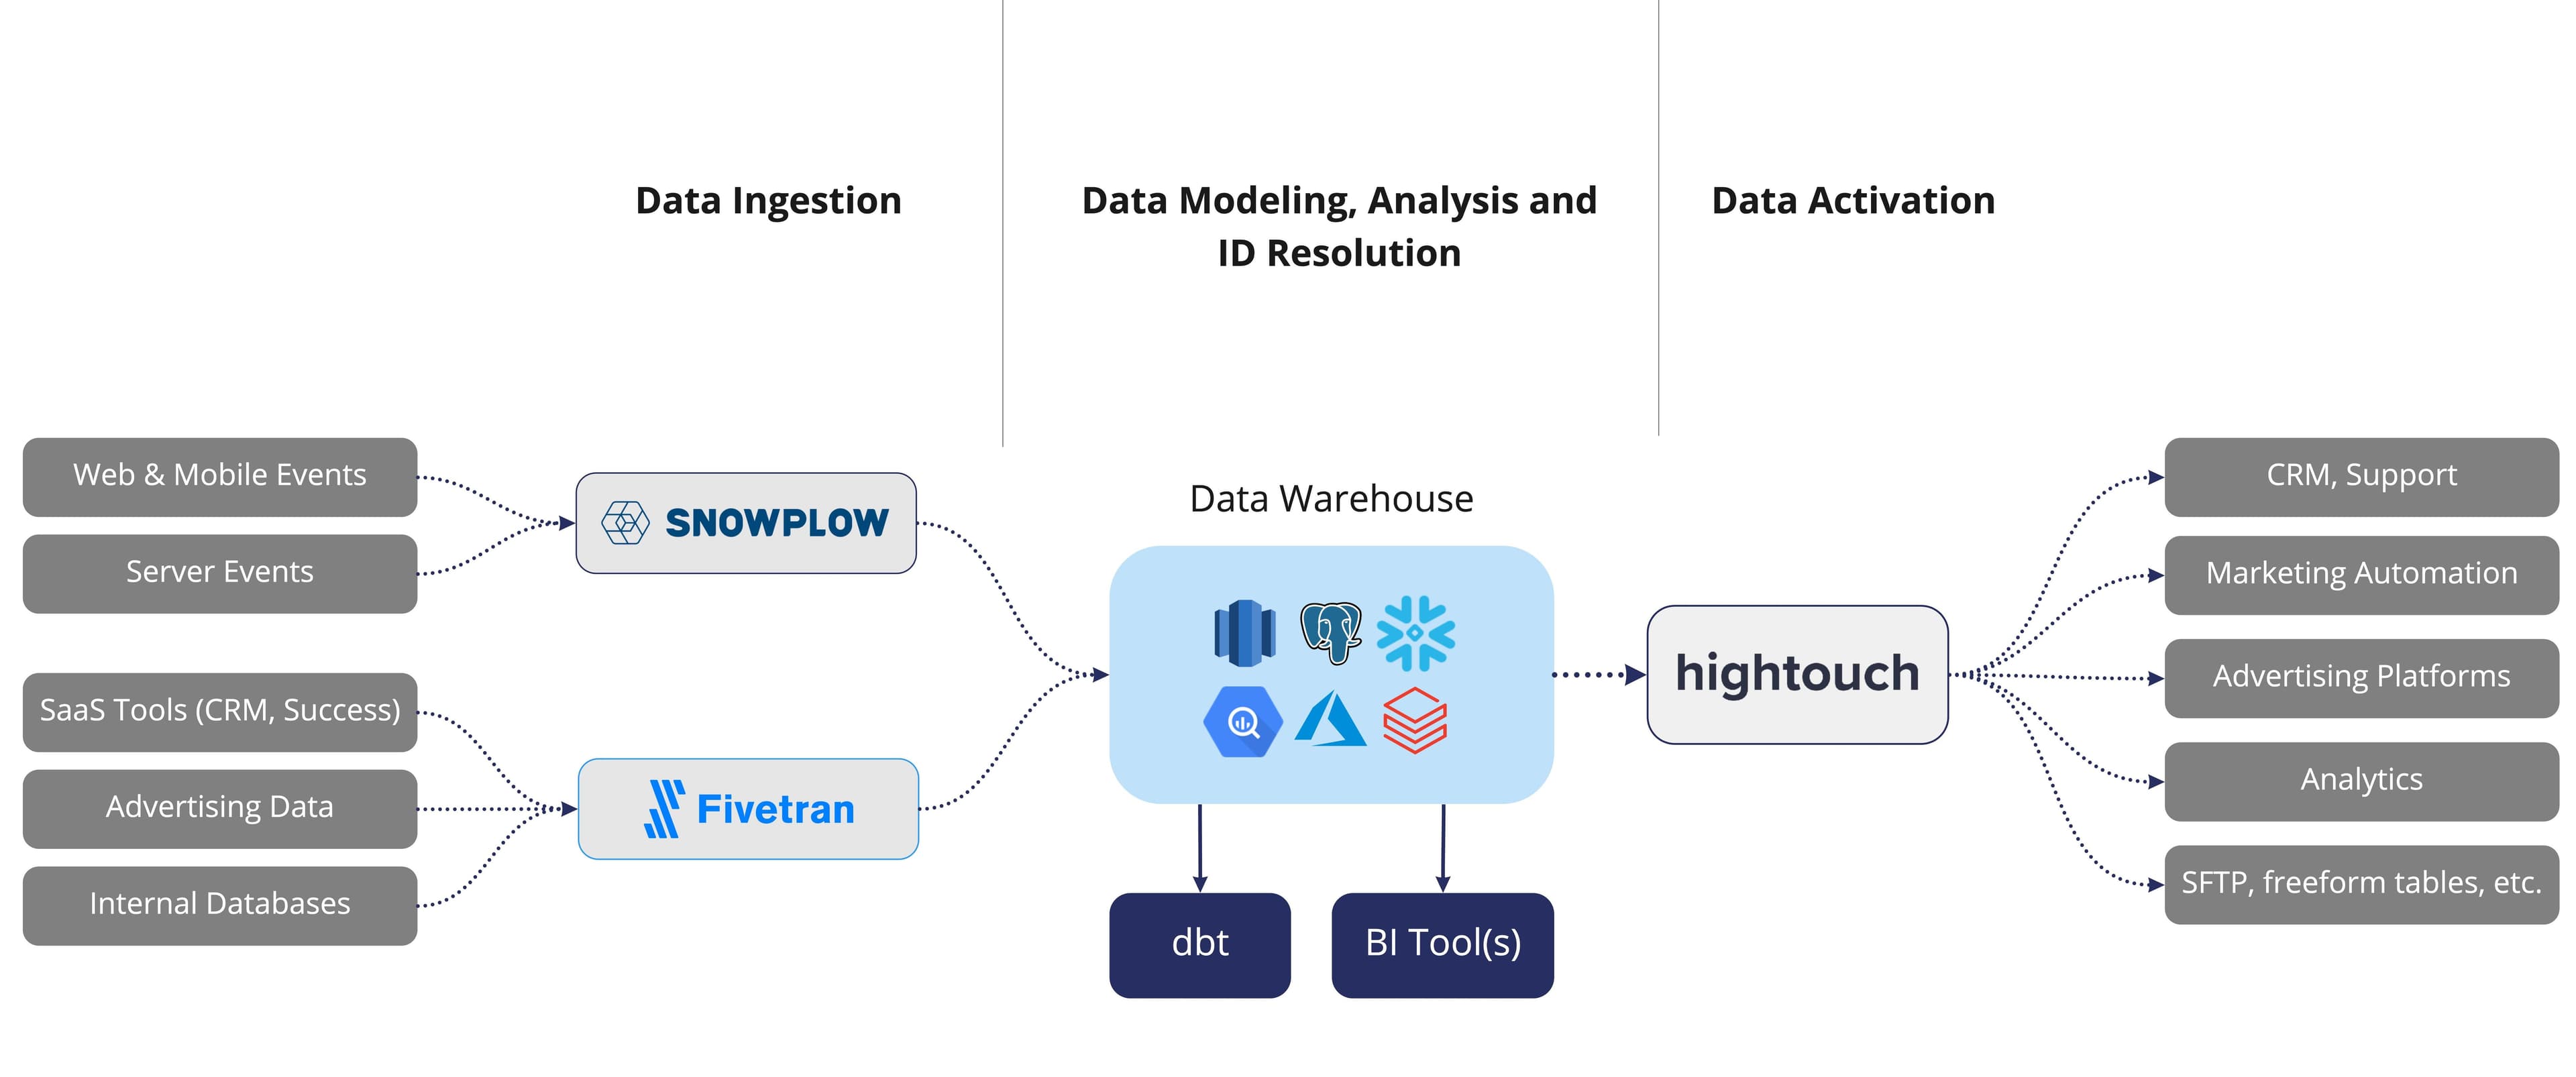
Today there are more tools than ever before in the data space, but you can break a data stack down into five core components:
- Data Integration: Tools like Fivetran automatically ingest data from your source to your data warehouse.
- Storage/Analytics: Data platforms like Snowflake let you easily store all of your structured and unstructured data and manipulate it in a way that makes sense to your business.
- Transformation/Modeling: Transformation tools like dbt allow you to build robust data models to make sense of your data.
- Business Intelligence: BI tools like Looker and Tableau let you visualize and manipulate your data through dashboards and reports.
- Operational Analytics: Data Activation tools like Hightouch allow you to sync your warehouse data directly to your frontline business tools.
Operational Analytics in practice
It's really easy to get stuck on your data. All too often, good ideas come out of analytics, but they fizzle into nothing when you actually need to put your data to work. Reporting alone is necessary but not sufficient. Reporting doesn't drive the actions that move the needle forward. Modern companies can no longer just make strategic decisions. You need to act on your data and do so automatically.
The goal of Operational Analytics is not to rearchitect your data stack but rather enhance the capabilities that you've invested in. Moving data out of the warehouse and into your SaaS applications creates a "continuous analytics" feedback loop, enriching the data in your business tools and reducing the turnaround time to access that same data.
When your data integration tool collects data from your external sources and ingests it back into the warehouse, it will be cleaner and more accurate than before. Given time, this will improve your data models and help turn your data into a competitive advantage.
How does Operational Analytics Work?
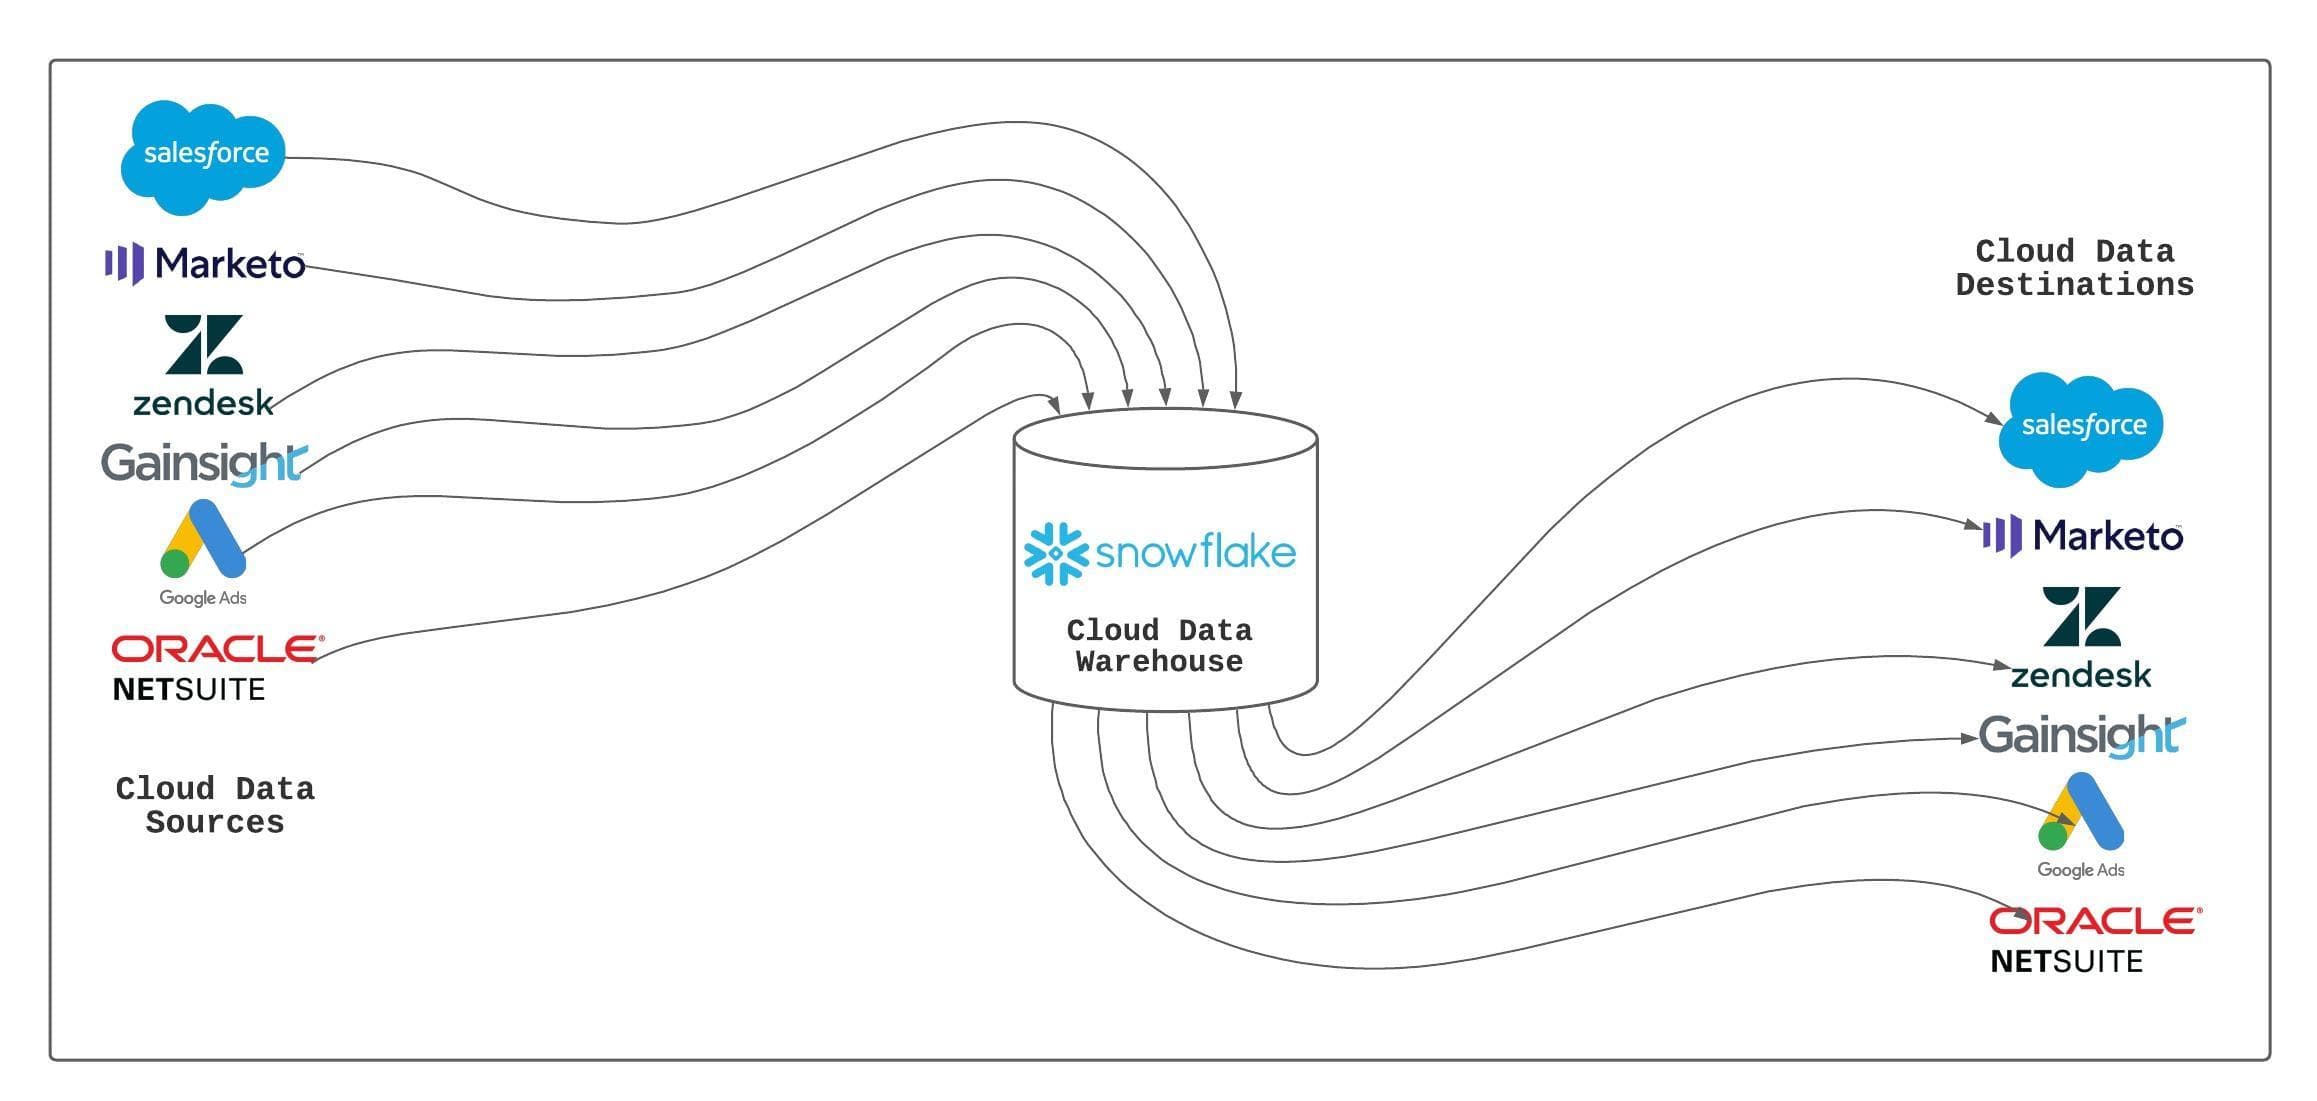
Under the hood, Operational Analytics platforms are powered by Reverse ETL. At its core, Reverse ETL is the process of querying against your data warehouse and syncing that data directly to your operational systems.
Reverse ETL works similarly to conventional ETL processes of extracting, transforming, and loading your data. However, the process is slightly different because, with ETL, you're writing data to a single API (e.g., your data warehouse.) With Reverse ETL, the process is the opposite. You're reading from your warehouse and writing to multiple downstream APIs (all of which are entirely different.)
Reading from a SaaS tool and writing to a warehouse is always easier than reading from a warehouse and writing to a destination because you control how your data is organized and structured. Conversely, every SaaS platform comes with its own unique API and nuances for organizing and structuring your data.
Operational Analytics Use Cases
Operational Analytics can solve and discover a near-unlimited number of use cases. However, many of the most practical use cases tend to be focused on automating and optimizing business processes and workflows in the tools your teams use on a daily basis.
Sales Teams
Getting access to relevant product usage data (e.g., last login date, workspaces, messages sent, active users, etc.) is extremely difficult for your sales teams. Your sales reps want to avoid hopping back and forth between tools every time they want to get a full view of the customer. In reality, they want access to the complete picture of your customer in their CRM so they can automate and personalize their outreach as efficiently as possible.
By syncing product usage data and relevant lead scores directly to your CRM, your sales reps can do real-time sales forecasting and build automated sequences tailored to specific customer actions. With Operational Analytics, you can also notify specific sales reps every time an account or user takes an action so they can follow up in real-time.
Marketing Teams
Your marketing teams want to build robust audience segments at a moment's notice, but to build rich cohorts, they need access to all of your customer data. With Operational Analytics, you can sync relevant audiences (e.g., shopping cart abandoners) directly to your ad platforms for retargeting or lookalike audiences to lower your customer acquisition costs (CAC) and optimize your return on ad spend (ROAS.)
You can also sync these same user lists directly to your favorite marketing platforms to power your cross-channel marketing efforts, whether that's email, SMS messages, or even push notifications. Best of all, since your marketing teams have actionable user data in their native platforms, they can experiment and run campaigns at a moment's notice with fresh, reliable data.
Product Teams
Your product managers are constantly trying to monitor usage patterns to optimize your in-app experience. With Operational Analytics, you can sync relevant customer attributes directly to your production database so your product teams can build personalized customer experiences and offer user-level recommendations.
Support Teams
Using Operational Analytics to sync relevant customer data to your favorite support tools like Gainsight or Zendesk, you can optimize your ticket resolution time and ensure that your support teams prioritize your highest-value customers. With Operational Analytics, you can even set up notifications to alert your support reps every time a user creates a ticket or runs into a bug within your app/website.
Data Teams
Operational Analytics enables your data team to focus on higher-value problems rather than building and maintaining custom integrations with every one of your operational systems. This freed-up time translates into better data models for your business and more optimized infrastructure and cloud costs. Operational Analytics ties the work of your data team directly to the outcomes your frontline business teams are driving.
Operational Analytics Benefits
The core differentiator behind Operational Analytics is data accessibility. Operational Analytics democratizes the data in your warehouse so that your non-data teams can leverage that information in tools like Salesforce, Hubspot, Google Ads, Iterable, Amplitude, Zendesk, etc. By pushing data back into the native tools of your end users, you remove the blockers between your business and data teams.
Operational Analytics ensures that everyone across your company (regardless of their technical skill) has access to the same robust view of your customer. With Operational Analytics, your business teams don't have to worry about getting access to your data because all the information they need is directly at their fingertips, allowing them to build personalized experiences for your customers at scale.
Getting Started with Operational Analytics
One of the significant advantages of Operational Analytics is that you don't need to rearchitect your data stack to get started. The easiest way to get started with Operational Analytics is to talk to your business teams and look at their most common requests and biggest pain points. You can use Operational Analytics to automate these requests and sync that data directly to your operational systems.
If you want to get started with Operational Analytics, Hightouch is the easiest way to start activating your data. Hightouch is a Reverse ETL tool that connects directly to your analytics layer and syncs data to over 125 destinations. Hightouch even has a visual audience builder for non-technical users so you can easily build and manage cohorts using the parameters your data team has set in place. The first integration with Hightouch is free, so you can sign up for a workspace and start syncing data today!