When a single business averagely uses 371 tools as well as different marketing channels to launch campaigns, it can be challenging to understand how customers engage across all of these channels and even more so when trying you want to measure your campaign performance. And without a sense of how well your campaigns are doing means, you have no chance of optimizing them.
In this article, you’ll learn:
- What is marketing analytics?
- What are the different types of marketing data?
- How is marketing analytics changing?
- Types of marketing analytics
- Marketing analytics use cases
- The most important marketing metrics
- Why is marketing analytics important?
- Best marketing analytics tools
What is Marketing Analytics?
Marketing analytics is the process of analyzing and synthesizing customer data from various marketing channels. By having strong marketing analytics processes and tooling, you can easily understand what campaigns and marketing activities are working or underperforming, allocate resources more effectively, and find opportunities to increase revenue and lower costs for the business.
What Are The Types of Marketing Data?
Without the right data, marketing analytics is useless. Two data groups are needed to gain insights to optimize marketing performance.
Offline data is gathered through interactions that aren’t online. For example:
- In-store purchases
- Telephone conversions
- Live event attendance and behavior
- Direct mail campaigns
Online data is captured digitally from locations like your website, application, or marketing platforms. For example:
- Website engagement
- Mobile app engagement
- Email platform metrics
- Advertising platform metrics
- Customer support engagement
- CRM data
How is Marketing Analytics Changing?
Marketing analytics is changing due to major consumer and technological shifts. Companies are being forced to rethink how they think about customer and marketing data to keep up. Three key trends drive companies to focus on a first-party data strategy to power their marketing analytics.
Trend 1: Third-party Cookies Are Going Away
Traditionally, third-party cookies and pixels have powered much of marketing analytics. These pixels allowed you to track user behavior across sites and between your ad campaign and conversion. With Google and others beginning to deprecate these cookies, companies need a new way to ensure quality analytics on all of their ad campaigns, and they are looking to use first-party data to do so.
Trend 2: Customers are Expecting More Personalized Experiences
Consumers are more data literate than ever, and with companies asking for more data from them, they will only give it if it benefits their experience. Therefore, there has been an increased focus on analyzing and using all the data marketing teams collect to influence and power these experiences.
Trend 3: Marketing is Getting More Complex
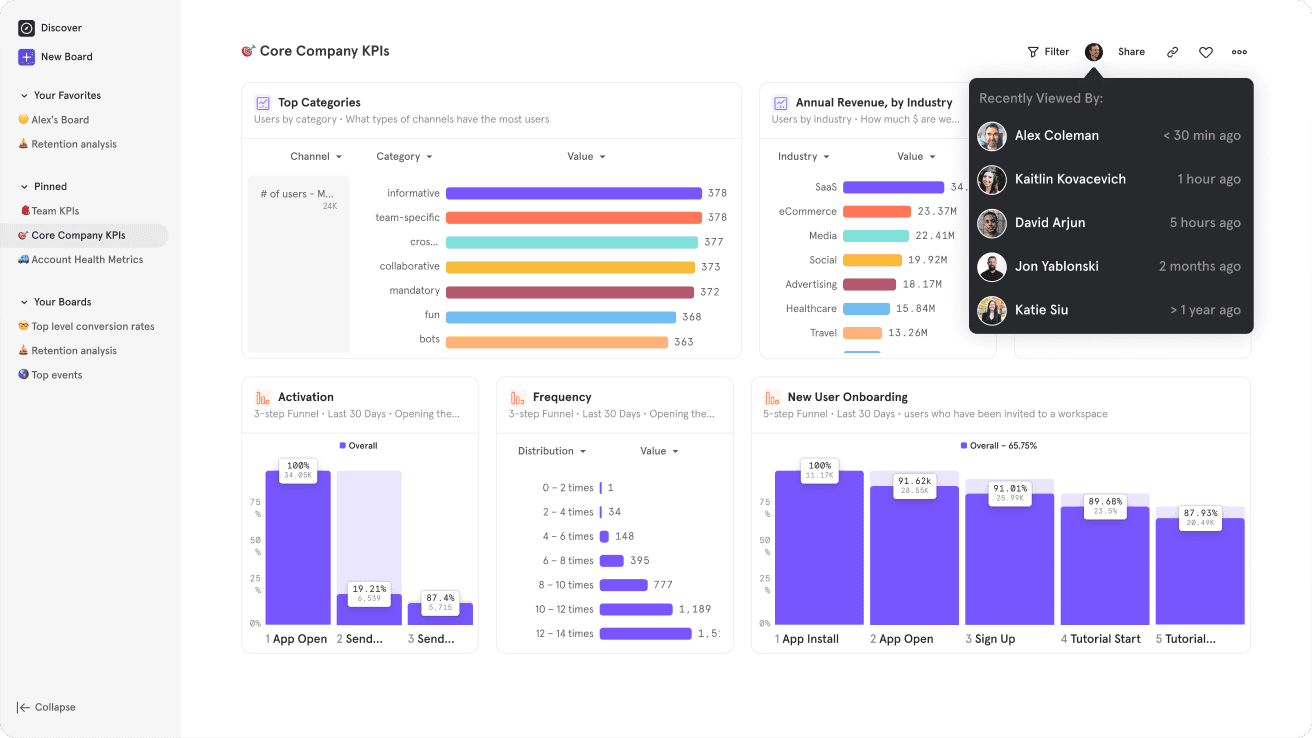
To stay competitive, companies need to optimize campaigns continually. To do that, marketers need easy access to data analysis to make quick decisions and speed up testing cycles. Therefore, companies are investing in self-serve analytics for their marketing teams, whereas previously, they relied on data and BI teams to pull reports.
To stay ahead of these shifts, companies are focused on creating world-class marketing analytics programs. The first step to doing so is centralizing all of the marketing data types into a centralized place.
Types of Marketing Analytics
Marketing analytics does not encompass just one type of analytics but multiple types, each providing insights into different areas of your business.
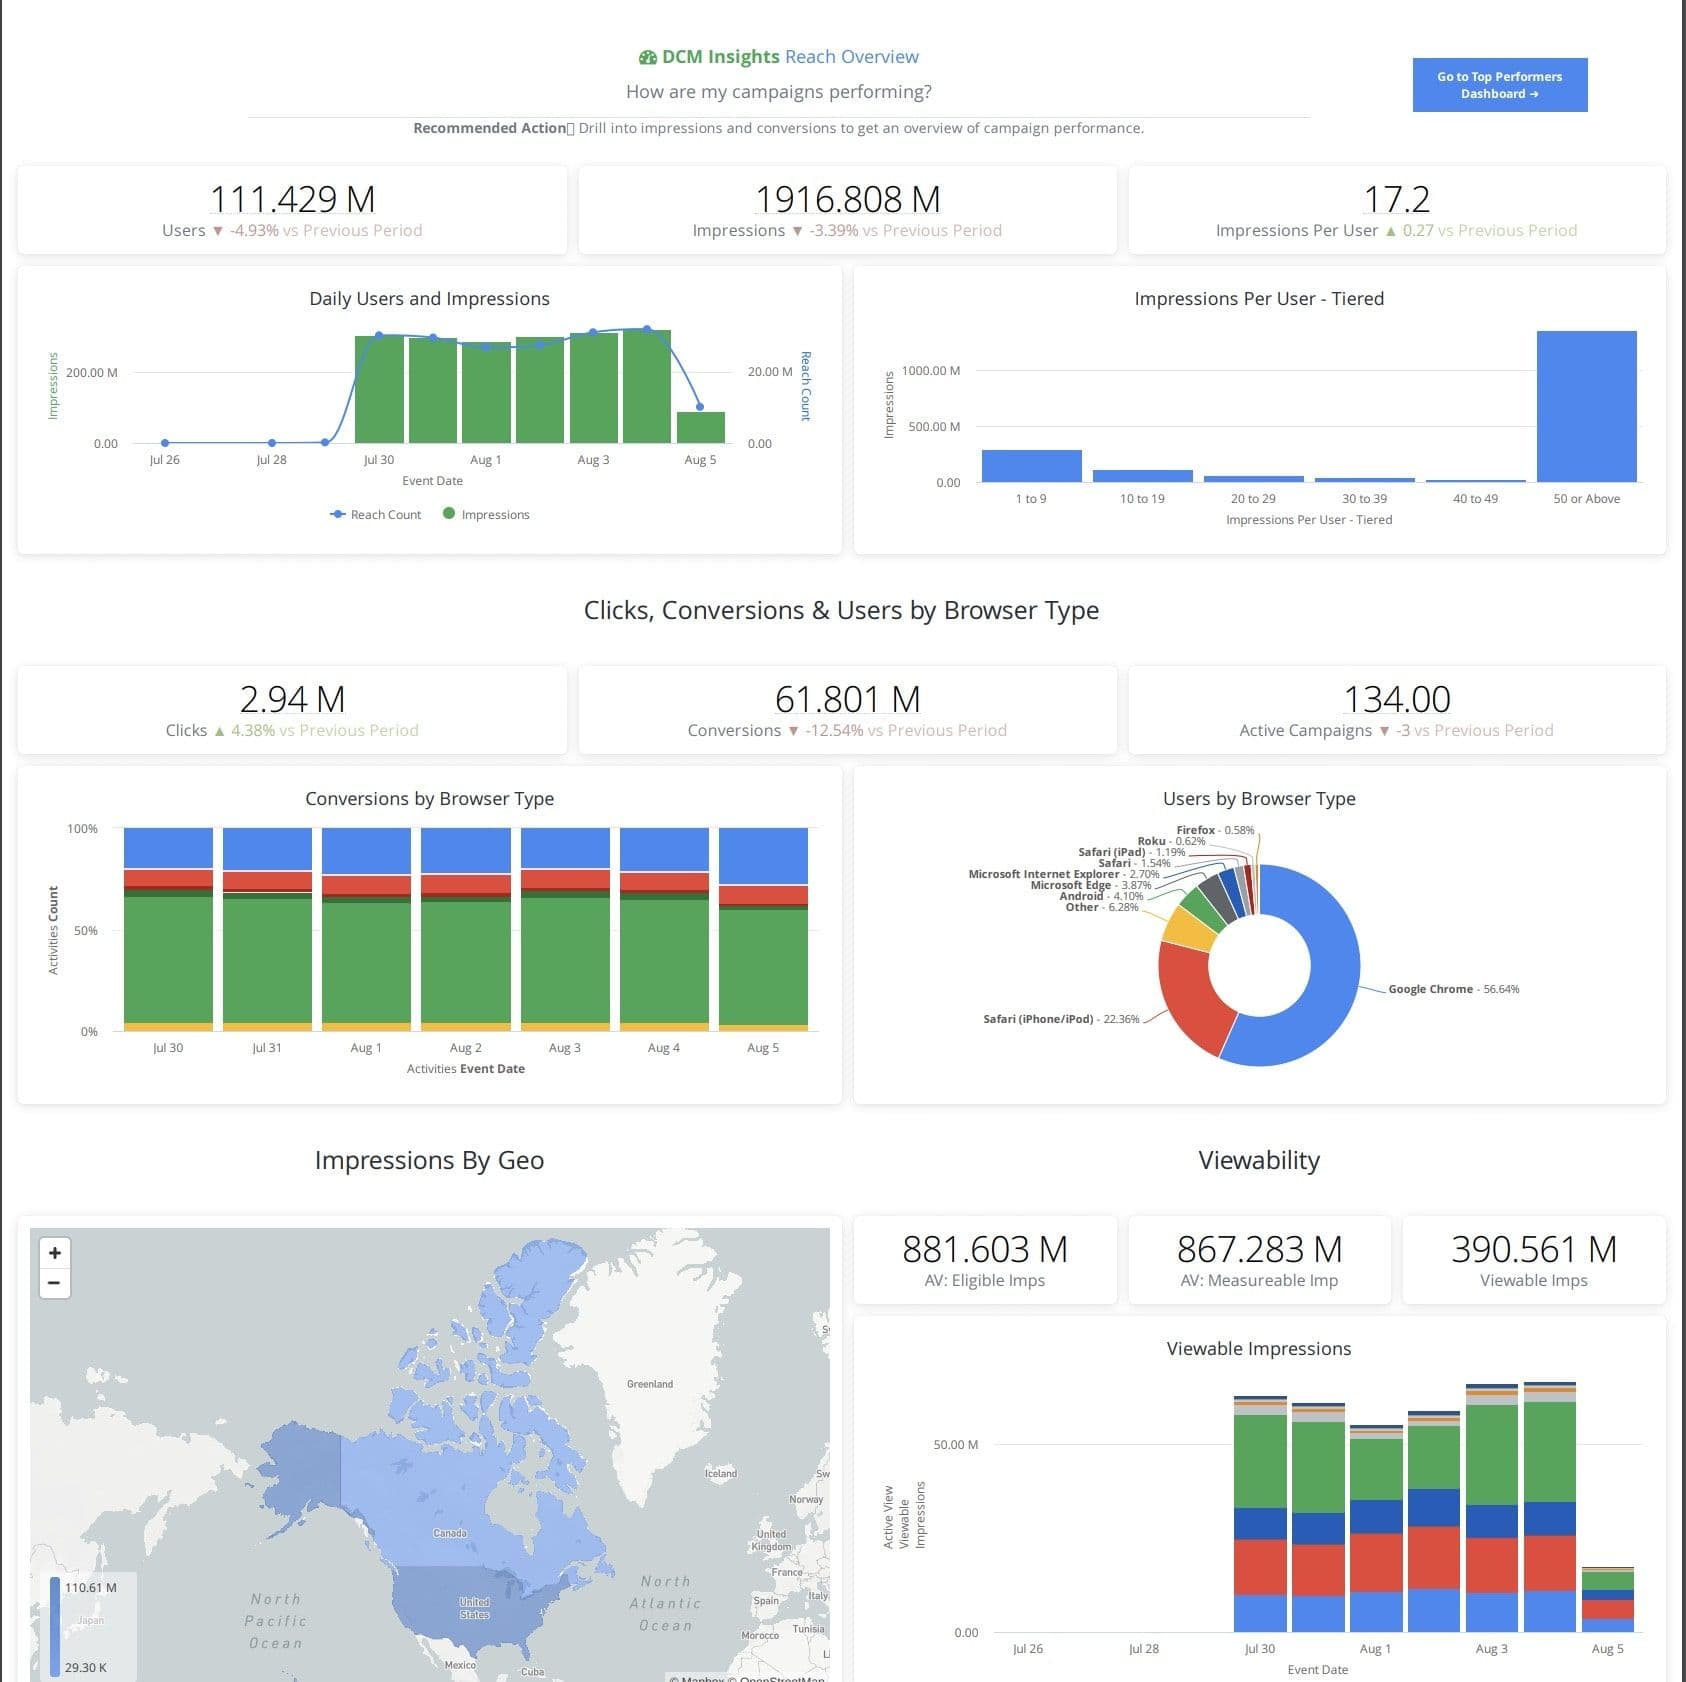
- Campaign analytics reveals how well your campaigns across different marketing channels, such as social media, email, and advertising, successfully drive a user to take action. It provides a feedback loop so you can iterate on each campaign to optimize performance.
- Web analytics helps you understand how users interact with your website and how they navigate through it. You can see the customer journey and conduct experiments to increase conversions on signups, purchases, and page views.
- Product analytics shows how your users engage with your app or product. It helps you optimize the customer experience to drive them to a specific goal and help them get the maximum value from your product.
- Behavioral analytics shows users' tendencies based on historical data. It can help you create segments based on past purchases or browsing history so you can personalize their experience to improve engagement rates and conversions.
Marketing Analytics Use Cases
Marketing analytics provides a range of insights that can be used to unlock various use cases. It can help with segmentation, journey mapping, personalization, experimentation, and ad optimization.
- Segmentation: With marketing analytics, you’ll see common customer themes or trends, which can inform different segmentation. Segmentation helps you avoid treating all customers the same and delivers the right message to customers at the right time to help increase conversions. For example, you could retarget users with Facebook ads who have recently added an item to their cart but abandoned it to encourage them to complete their purchase.
- Journey Mapping: Knowing how your customers navigate your site can highlight areas where customers drop off and what might have led them to that decision. Knowing what areas are a problem means you can optimize them to prevent any future drop-offs. For example, if you were an e-commerce company noticing a high abandonment rate in your checkout process, you could analyze where the largest drop-off happens and then focus on eliminating or enhancing that specific step.
- Personalization: Marketing analytics allows you to explore your customers' personalities and preferences more deeply by analyzing their behavior and browsing history. A deeper understanding of your customers allows you to personalize their experience with tailored content they would be interested in seeing, leading to increased conversions. For example, if you were an e-commerce store, you could leverage a user's purchase history to personalize the homepage with products they are likely interested in.
- Experimentation: Experimentation allows you to change certain areas within your product or website to see if they increase your conversion rates. You can conduct A/B testing efficiently because you can review the outcomes of the variants. For example, if you’re a large e-commerce company, you can use A/B testing to compare the effects of displaying product recommendations versus not displaying them and measure how this influences the number of products a user purchases and their average order size.
- Ad Optimization: Marketing analytics provides information about what ads customers click on and convert. You’ll then see which ad campaigns are low-performing so you can optimize them or increase ad spend in high-converting campaigns so you’re spending your ad budget efficiently.
The Most Important Marketing Metrics
Regarding marketing analytics, the type of data you report on will provide you with the insights you need. A handful of metrics are important to measure so you can see how your marketing channels are performing and what you can do to drive performance.
Website Analytics
Website analytics aims to understand where your demand is coming from, how well that demand is being converted into leads, and what messaging or framing is working best. There are a few categories of things to analyze here:
- Website Traffic: By analyzing metrics like total visitors, unique visitors, page views, and average session duration split by traffic sources like paid media, SEO, or direct traffic, you can understand what marketing efforts drive the most interest in your products.
- Bounce Rate: When analyzing website traffic, you can also consider bounce rate, which is the percentage of visitors immediately leaving your site. This can help you understand poor-performing traffic sources and landing pages you need to improve.
- Conversion Rate: You can see the percentage of website traffic that converts to a lead or sale. This helps you understand which products, landing pages, and messaging resonate most for each traffic source or user persona.
Marketing Channel Analytics
By analyzing each marketing channel as an individual funnel, you can identify areas to optimize from the top of funnel ad message and targeting through the landing page conversion rate to increase your return on investment per channel.
- Advertising Channel Metrics: The key metric is the cost per acquisition. To influence that, you can focus on cost per click, ad spend, and return on ad spend. This can help you understand what ad campaigns are performing well to increase the budget and low-performing ways to stop or improve.
- Email Channel Metrics: Understanding how metrics such as open rate, click-through rate, and unsubscribe rate perform can help you improve your email strategies by emulating successful campaigns.
- Social Media Metrics:To measure how well your social media channels are performing, metrics like engagement rate, follower growth, and reach and impressions can show how well your content engages with your customers.
Business Level Metrics
Looking at your business and marketing program holistically, you can find larger opportunities for optimization across channels. Here are some of the key metrics to look at:
- Return on Investment Metrics: Looking at metrics such as net profit, gross profit margin, and return on marketing investment can give you a good idea of what areas of your business are profiting and help you address any areas that are causing concern.
- Lifetime Value Metrics: Understanding customer lifetime value, average purchase value, and average customer lifespan can give you insights into which types of customers you might want to focus on for greater gain.
- Retention Metrics: To maintain your recurring revenue in your business, you should monitor metrics such as churn rate, net promoter score, and repeat purchase rate so you can understand if your business is meeting customer expectations and continuing to use your product to gain value.
The above metrics are some of the most common you’ll see being captured, but you might have other priority metrics to monitor. It depends on your business outcomes. For example, if you were a retail business like Nike, you would be more interested in repeat purchases or your cart conversion rate. Similarly, if you were a streaming company like Netflix, you would be more interested in the content watched or the time spent on the app.
Why is Marketing Analytics Important?
Marketing analytics gives you a vision of how your marketing channels are performing so you can make changes to optimize your results. You might notice that your latest email campaigns aren’t performing as well as before. Has something changed? Or are you doing something differently compared to last time?
Marketing analytics lets you step back into the past and see which of your historical marketing campaigns performed better. You can then analyze what was different and use that to improve your future campaigns. You can also use marketing analytics to help try new tactics to see if you can get a positive outcome. Does using a lookalike audience help improve ROAS? Does changing the headline of your website help increase conversions? Without marketing analytics, you wouldn’t have access to the results of these experiments. They are a marketer's secret weapon to help drive the performance of your marketing channels across your business.
To help you understand your marketing analytics, three different approaches can help inform you when making decisions to increase performance.
- Descriptive analytics gives you an overall picture of what’s happening in your marketing channels. It allows you to see the direct impact of changes you’ve made to your business so you can recreate winning strategies to get the same results. For example, if you launched a new feature, you would know which marketing channels had the most signups and focus on those to get the same or better results.
- Predictive analytics takes your existing data and uses the power of AI and machine learning to predict future outcomes. These predictions are not 100% accurate, especially if many variables can affect the outcome (look at how good predicting the weather is), but they can provide you with a sense of what might work and if it’s worth a test. For example, you could be a subscription company like HelloFresh and use predictive analytics to predict which customers are the most likely to churn and implement new campaigns to prevent them.
- Prescriptive analytics helps you work out the outcomes of multiple scenarios, making it perfect for envisioning the different outcomes of experiments or scenarios. This gives you an idea of what might work best so you can run a test to see if it’s true. For example, if you’re an e-commerce company with a new sales funnel, you could see what would happen to revenue if you added an upsell or a cross-sell and see what combinations work out the best.
Best Marketing Analytics Tools
It’s ideal to use a marketing analytics tool to manage and consume your marketing analytics insights. Here are some of the top marketing analytics tools.
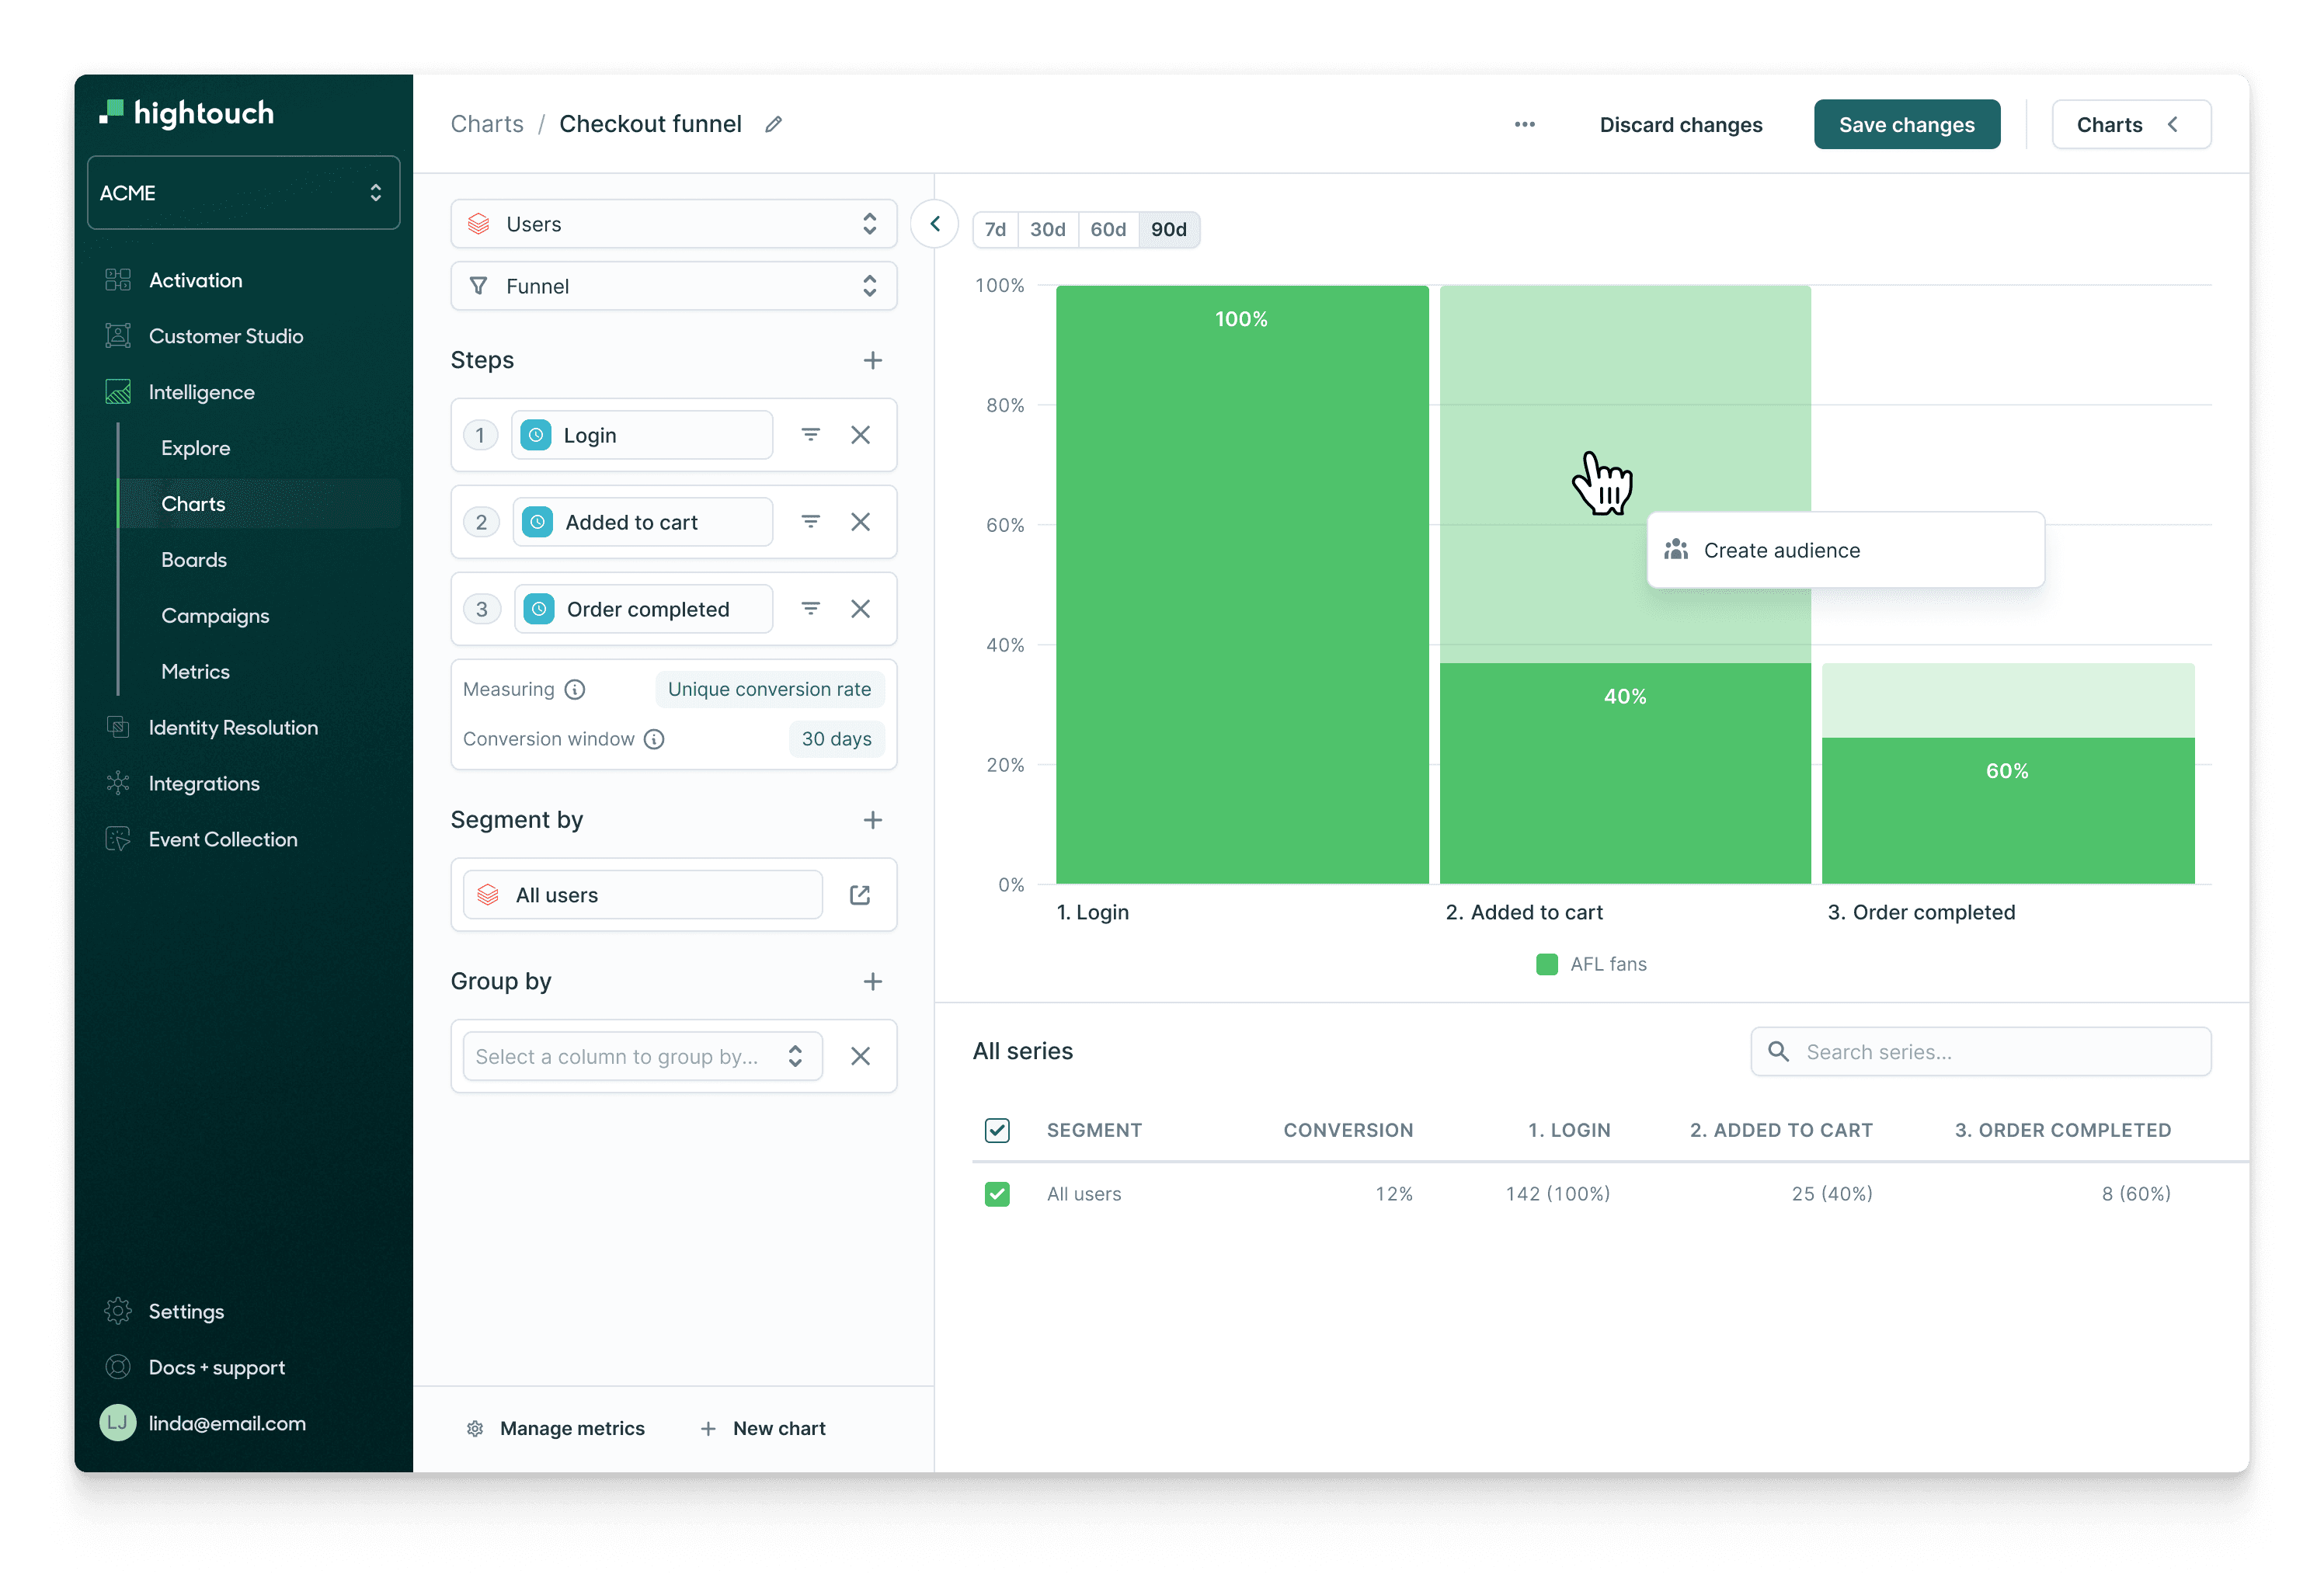
Hightouch
Hightouch Campaign Intelligence is a self-service analytics tool designed to analyze your marketing channels using all your customer data in the data warehouse. This tool provides a single location for measuring campaign performance, creating custom funnels, and running A/B tests across channels. It also features an AI-powered copilot to garner insights much easier than sifting through dashboards and reports yourself. More importantly, Hightouch is a data activation tool, so you can take action on your marketing analytics insights by syncing your data into your end tools to carry out any experiments or changes you want to make.
Google Analytics
Google Analytics is a web analytics tool designed to help you understand your website and app performance through various metrics and insights. GA4 is built to operate across platforms and uses an event-based data model, providing a more user-centric approach to measurement. This setup lets you understand customer interactions across different touchpoints. The platform incorporates advanced machine learning models to generate predictive insights. These insights can forecast user behavior, such as the likelihood of a purchase or churn, enabling you to create targeted audiences for more effective campaigns.

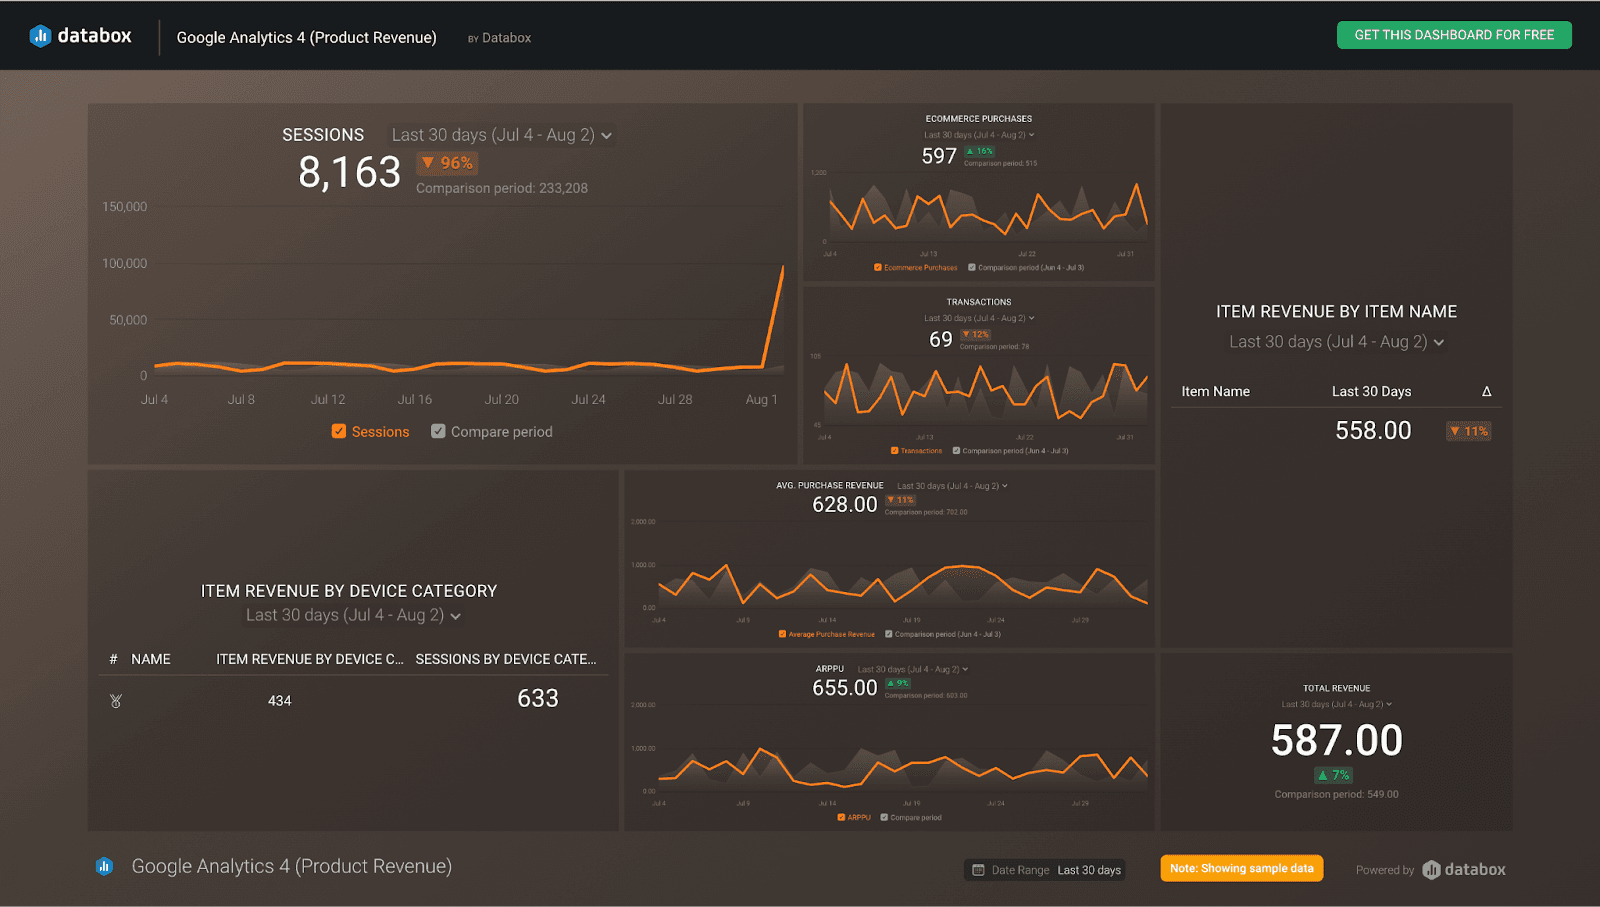
Databox
Databox is an analytics platform designed to simplify data centralization, visualization, and performance tracking. It integrates data from multiple sources, such as Google Analytics, HubSpot, and various databases, into a single platform. Databox helps you to make data-driven decisions by providing insights into campaign performance, user engagement, and sales metrics.
Looker
Looker is a data analytics platform that provides robust tools for marketing analytics. It allows you to integrate and analyze data from various sources, offering customizable and shareable analytics. Looker allows you to integrate with multiple data sources such as Google Analytics, Google Ads, Facebook Ads, and more, enabling a comprehensive view of marketing performance.
Tableau
Tableau is a visual analytics platform that enables data-driven decision-making through data visualization, dashboard creation, and real-time analysis. It offers features like customer segmentation, campaign performance tracking, sales funnel analysis, and social media analytics. These tools help marketers identify target groups, measure and optimize campaigns, and visualize conversion rates.

Mixpanel
Mixpanel is an analytics platform that provides insights into user behavior across web and mobile applications. It can help identify the most effective marketing channels by analyzing multiple touchpoints along the customer journey. It also supports A/B testing so you can test and implement different strategies and create tailored dashboards that provide actionable insights into key performance indicators and user segments.
Final Thoughts
As your business grows, so do the marketing activities and channels you’re trying to implement. You start to collect tools to help you. But you end up hopping between tooling to get the answers you need because they don’t have access to all your data.
To avoid this, it’s better to use a tool like Hightouch to access all the data sitting in your data warehouse. This way, you can get a full view of your campaigns with one tool without any context shifting. If you want to learn more, book a demo with one of our solutions engineers.