18% of cart abandonments are due to long, complicated checkout processes. In 2000, Amazon introduced a 1-click checkout and revolutionized websites. Since then, every other company with an online website has tried to copy this format and create a seamless experience for their customers, and this need has given rise to web analytics.
In this blog post, you’ll learn:
- What is web analytics?
- How web analytics work
- Web analytics metrics
- Web analytics use cases
- How to implement web analytics
- Web analytics tools
What is Web Analytics?
Web analytics is the process of tracking, capturing, analyzing, and reporting visitor behavior on your website. Capturing this data lets you see how users engage with your site, what products they’re interested in, where they drop off, and even the traffic source they originate from.
The goal of web analytics is to understand how users navigate your website so you can make changes to improve your conversion rate and drive users to take action. With web analytics, you can conduct experiments on your users to see how that impacts their navigation and interaction on your website and ultimately impacts conversions like signups, purchases, page views, etc.
Web Analytics Metrics
At a high level, website analytics allow you to understand and improve your digital user experiences by collecting and summarizing key performance metrics. But what specific metrics should you be capturing and why? Here’s a summary of the most important web analytics metrics:
- Page views: How many pages are being viewed, and which are most viewed?
- Page views per visit: How engaged are the users visiting your site? Are they exploring a lot of content? Are they having trouble getting to the page they need quickly?
- New visitors: How effective is your new marketing campaign or channel? Are you attracting new interest in your product or service?
- Returning visitors: Are users returning to your website or product? If not, what can you do to drive higher retention and re-engagement?
- Traffic sources: Where are your visitors coming from (e.g., paid ads, referring domains, email, Google Search, etc.)? How can you invest more in the marketing channels that are working?
- Bounce rate: How many users leave when they see your landing page? How can you improve the page experience to drive more interest immediately?
- Average session duration: How long are visitors on your website? How can you increase this so you can sell more ads per user?
- Breakdown by location: Where are your users visiting from? Do your users live in the UK or the US?
- Breakdown by device: Are more users visiting on desktop or mobile? How can you improve your UX on your site to align more with the types of devices people use?
- Button clicked: How many people are clicking on your CTA? What’s stopping people from signing up, submitting a demo, or checking out?
- Conversions: How many users are taking an action that generates revenue for your business? Did they sign up for a demo, purchase a product, subscribe, etc.?
- Revenue per action: How much are customers paying you per purchase? How can you increase “cart size” by up-selling additional products or promoting more valuable products more prominently?
- Revenue per visit: What is the overall value of driving one more visitor to the site? This can help you prioritize marketing initiatives and set budgets.
Note: this is not an exhaustive list. It would be nearly impossible to summarize a complete list because every business has nuances, different outcomes, and key performance indicators they’re optimizing toward. For example, if you are a B2B marketplace, you might want to look at the number of signups/demos. If you are a travel booking site, you probably care more about actual bookings.
Understanding these metrics helps you optimize your customer journey to drive your users toward the desired action you want them to take.
How Web Analytics Works?
Website analytics is a simple way to gather qualitative data on how users are engaging with the digital side of your business at scale without having to talk to individual users. The data you collect from web analytics helps you see how customers behave and navigate, giving you valuable insights into what might be causing friction or what users are finding engaging. These insights ultimately lead you to strategize on how you can increase your conversion rates.
For example, if you run an online subscription business, you might want to focus on increasing subscribers. However, you might notice that users are more likely to drop off when they are forced to enter their payment information, so adding support for Google or Apple logins could be a great way to alleviate this friction.
Fundamentally, there are four core components to web analytics:
- Understand Your Goal: You should have a “north star” metric that everyone in your company is focused on and ensure that every department in your business is in alignment and driving toward this objective.
- Collect Data: To start leveraging web analytics, you need to have a way to capture behavioral data from your website. The best way to do this is to implement an event tracking SDK on your website to capture events you define.
- Analyzing Data: Once you've collected your data, you’ll need to store it in your data warehouse to model and transform it for analysis to power your operational, reporting, and marketing-related use cases.
- Conduct Experiments: Once you have data from your website, you need to conduct tests to see how your users react to changes on your site. The best way to do this is through incrementality testing, where you separate a holdout group and measure it against your treatment group.
Web Analytics Use Cases
Web analytics doesn’t just give you insight into how your customers are behaving, it also unlocks new use cases for your business that you can use to drive additional value. With that in mind, here’s a list of some of the main use cases for web analytics:
- Conversion Rate Optimization: Web analytics will reveal areas on your site that aren’t converting well so you can work on improving them. For example, you might not be happy with the conversion rate of your homepage, so you could experiment, starting with changing your headline, to see if it improves conversions.
- Audience Segmentation: Web analytics gives detailed information on your customers. You can use that data to build audiences based on certain attributes and traits you define, such as user behavior or demographics. For example, you could create a list of shopping cart abandoners to retarget on Facebook.
- Experimentation: If you want to conduct A/B testing, web analysis will provide the data you need to confirm your hypothesis. With web analytics, you can test multiple landing page versions, one with an image and the other with a video, to see which achieves a higher conversion rate.
- Customer Journey Mapping: Understanding the customer journey can highlight areas where customers drop off your site so you can understand what led to that decision. For example, if you were an e-commerce company and saw your checkout flow had a high abandonment rate, you could investigate where the biggest drop-off occurred and work on either removing or improving that step.
- Ad Optimization: Web analytics can show you what ads customers click on and which convert customers. This way, you can either turn off or lower the budget of underperforming ones and double down on the high-converting campaigns.
- Search Engine Optimization Improvements: Knowing what keywords customers are searching for to find your website means you can optimize your pages to show first in search results. For example, if you sell golfing clothes, you might see that most customers find your site through the keyword “golfing apparel” rather than “golfing clothes,” so you can focus on that keyword to help rank higher in search.
How to Implement Web Analytics?
To begin with, you need to start collecting data. The ideal way to do this is via an event tracking tool that can capture clickstream data. Most tools use SDKs that you embed in your website and consist of libraries of pre-written code that Javascript powers. SDKs help you set up triggers for the events you want to track. Event handlers, such as onClick for button clicks, trigger the event tracking process and send the data to your analytics database. You can configure each event to capture the relevant data you need for your web analytics. Once the data is in your analytics database, you can model it ready for analysis.
Web Analytics Tools
Life is much easier when you have a fully managed tool to manage and capture data from your website. Choosing an event tracking solution to capture web analytics can be difficult, so here’s a quick list of popular web analytics tools available today.
Hightouch
Hightouch has two products to help you with web analytics: Hightouch Events and Hightouch Customer Intelligence.
Hightouch Events provides a fully customizable approach to collecting and storing events directly in the data warehouse. The platform uses a simple SDK that is backward compatible with other major event collection providers, so you can easily migrate solutions if you’re using another vendor. Hightouch also provides a feature called Data Contracts, which allows you to define exactly what data you want to collect to optimize toward data quality.
Hightouch Customer Intelligence is a self-service analytics feature that helps you answer your marketing questions. It will help you measure, explore, and analyze your web performance directly from your data warehouse and lets you view them in various charts. It also provides a chat-based interface, powered by AI, so you can get answers about your data in plain English.
Google Analytics 4
Google Analytics is a web analytics service offered by Google that tracks and reports website traffic. It provides detailed insights such as the number of new and existing users, referral source, average time on page, and much more. It primarily uses JavaScript tags (called "gtag.js" or "analytics.js") embedded on your website to collect data. When a user visits a web page, the tag runs in their browser and collects data about their session, sending it to Google Analytics servers. You can then report on that data, depending on your business goals.
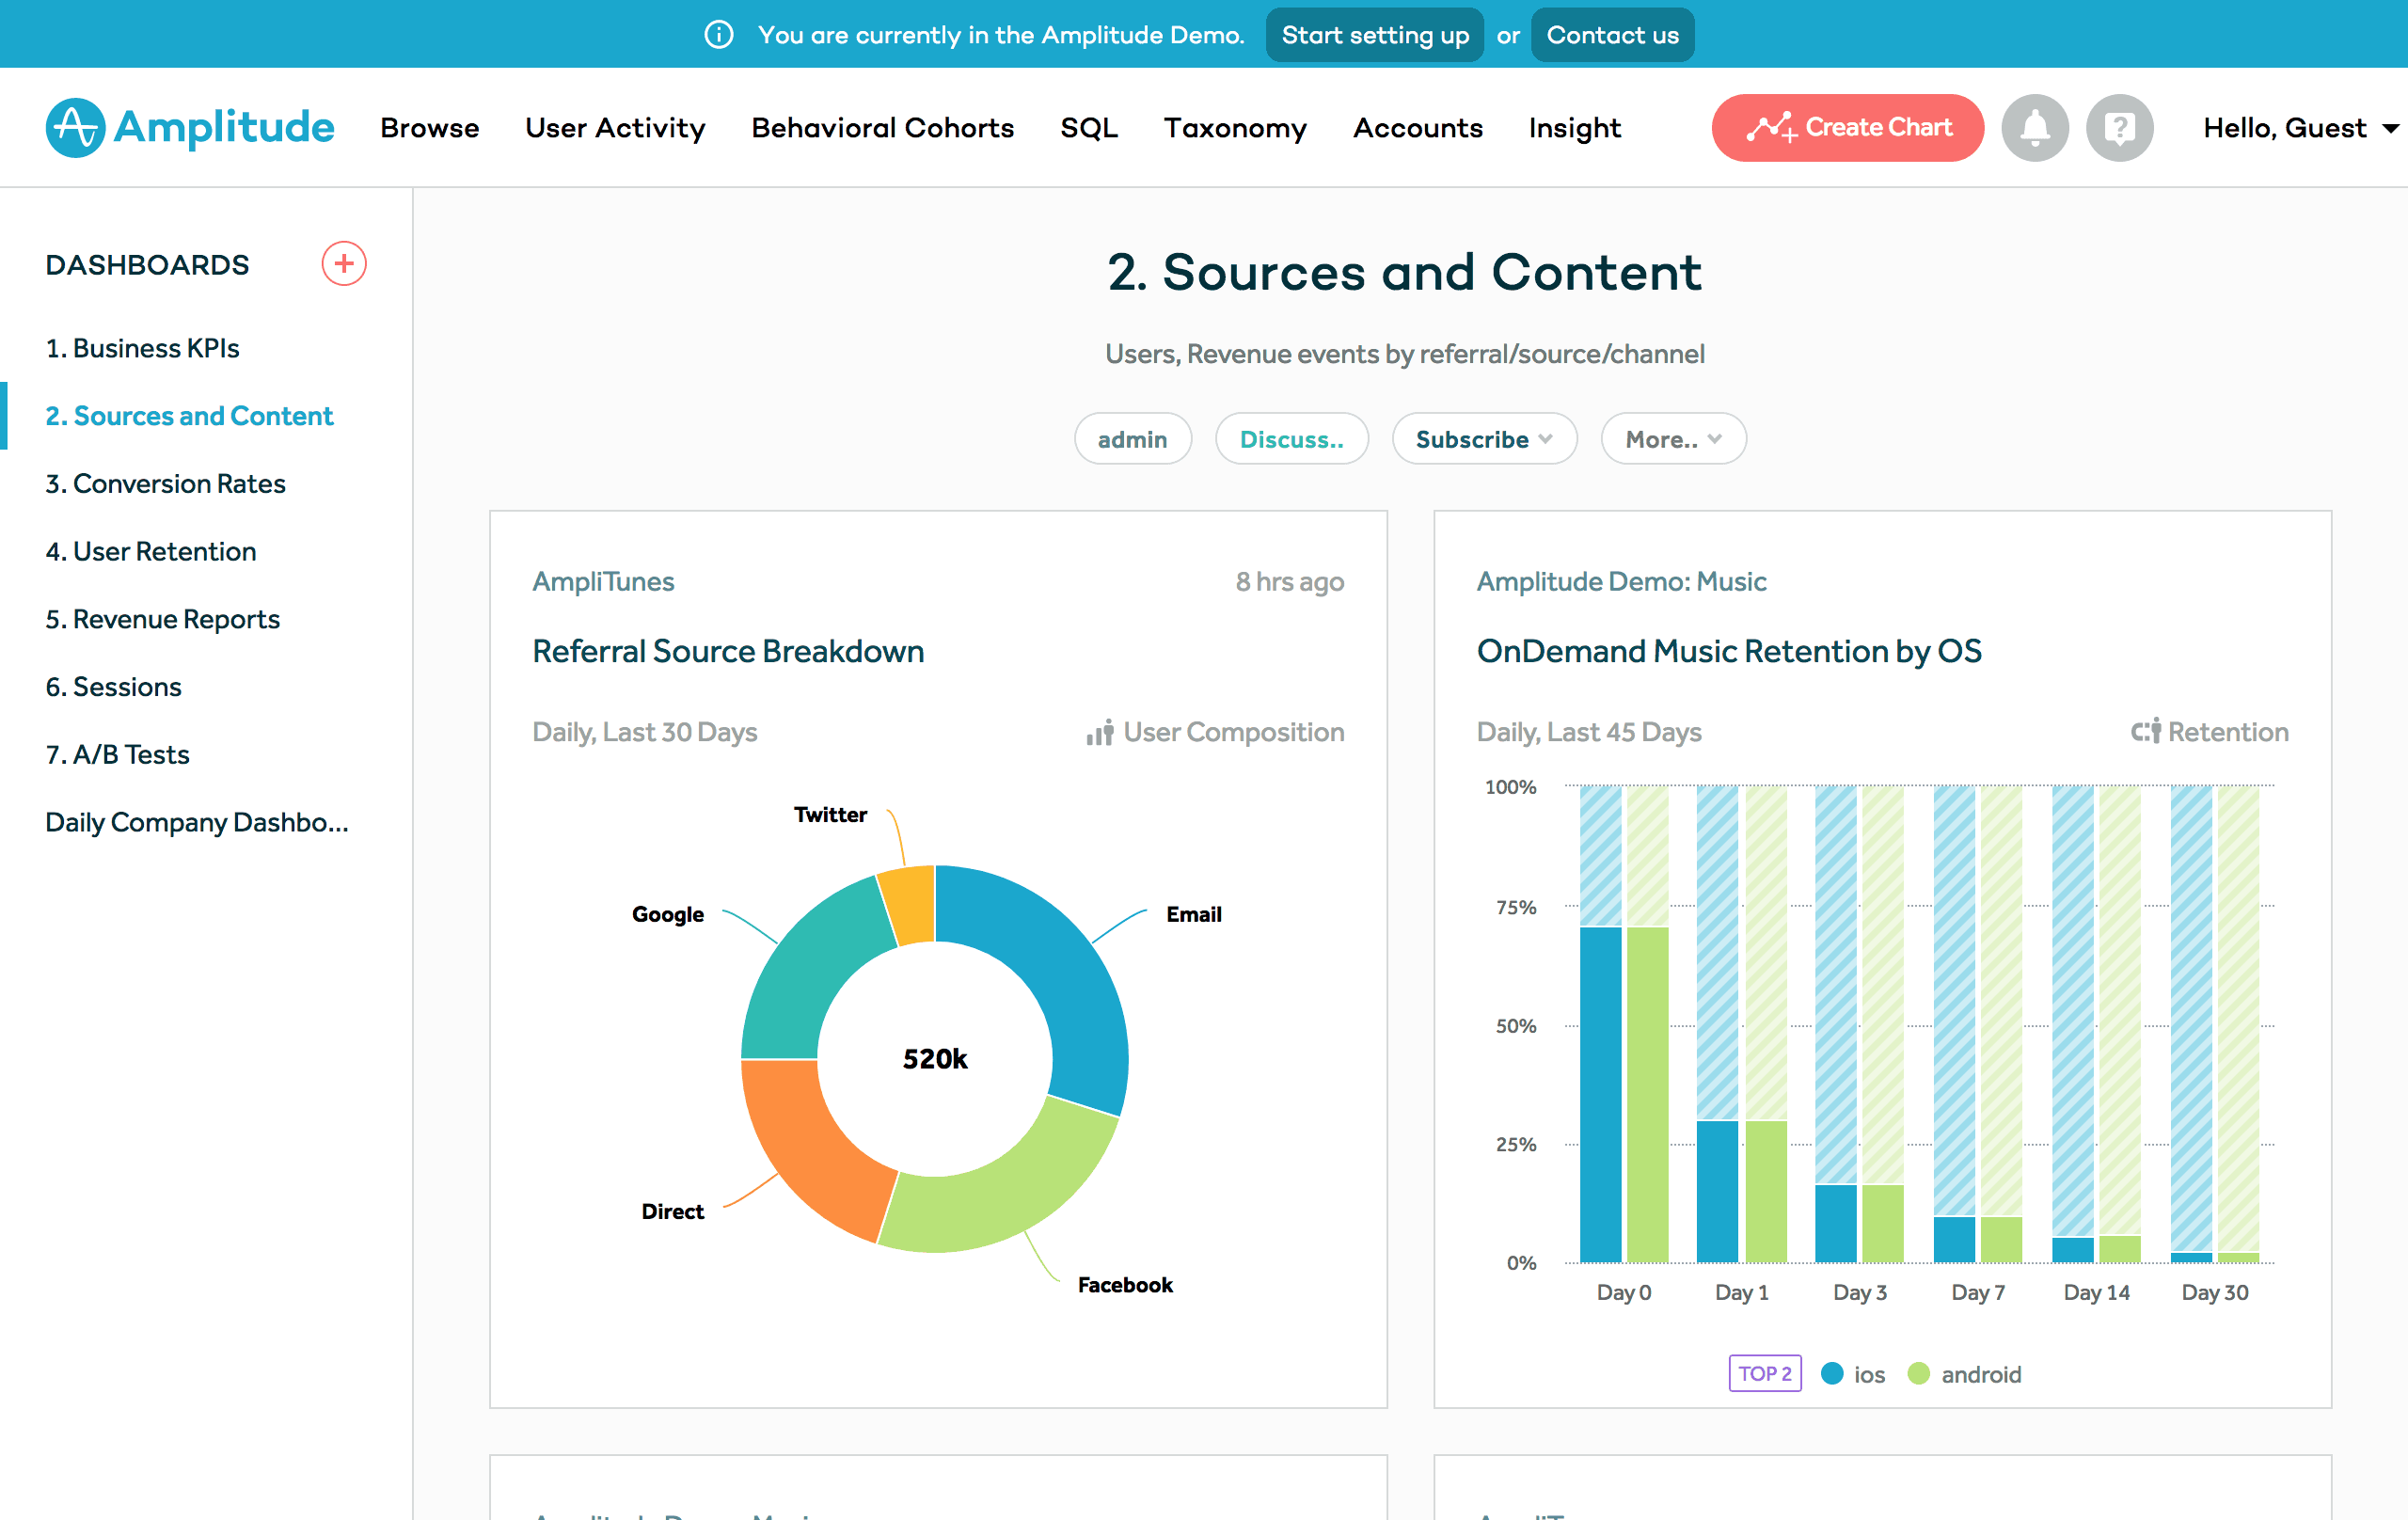
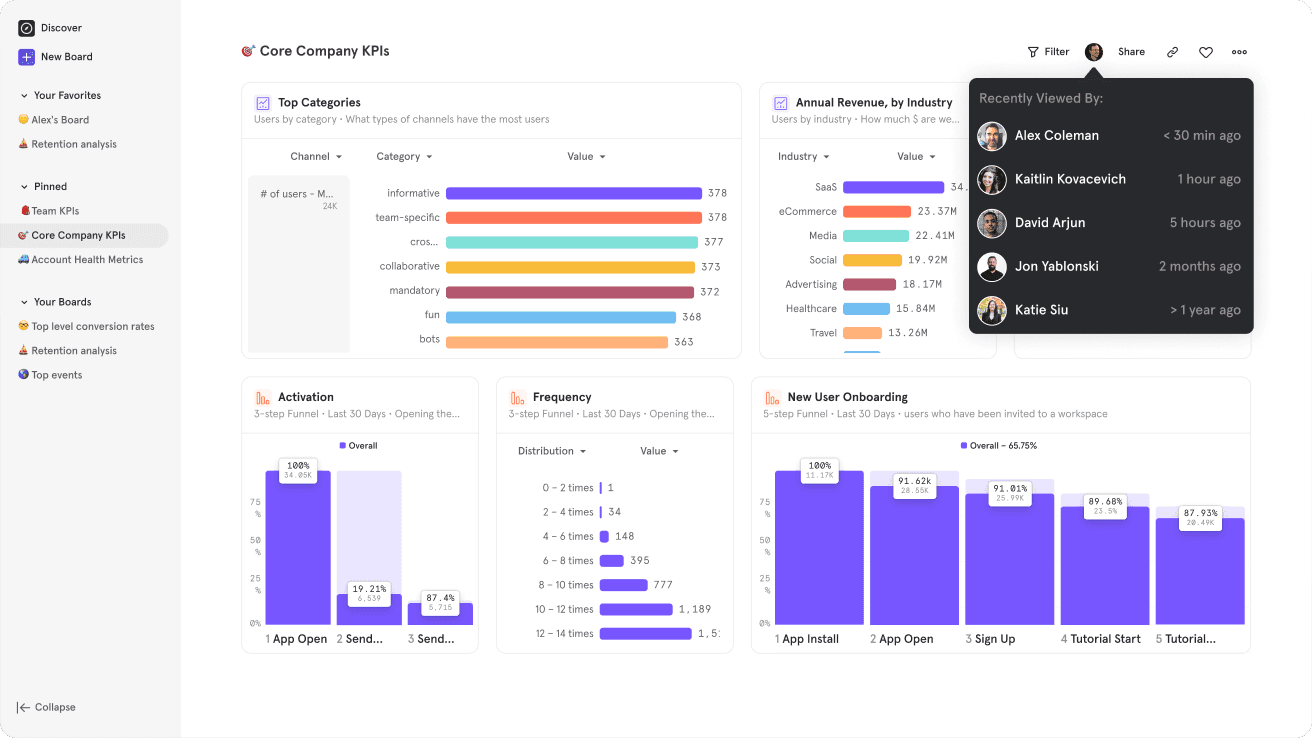
Amplitude
Amplitude provides analytics for mobile and web platforms, providing actionable insights into how users behave on your website. It offers an event tracking product to track specific user actions, such as clicking a button. The platform can also analyze a user's path through your website to help you understand the customer journey. The cohort analysis feature lets you analyze the behavior of groups of users so you can gather deep insights to optimize your website.
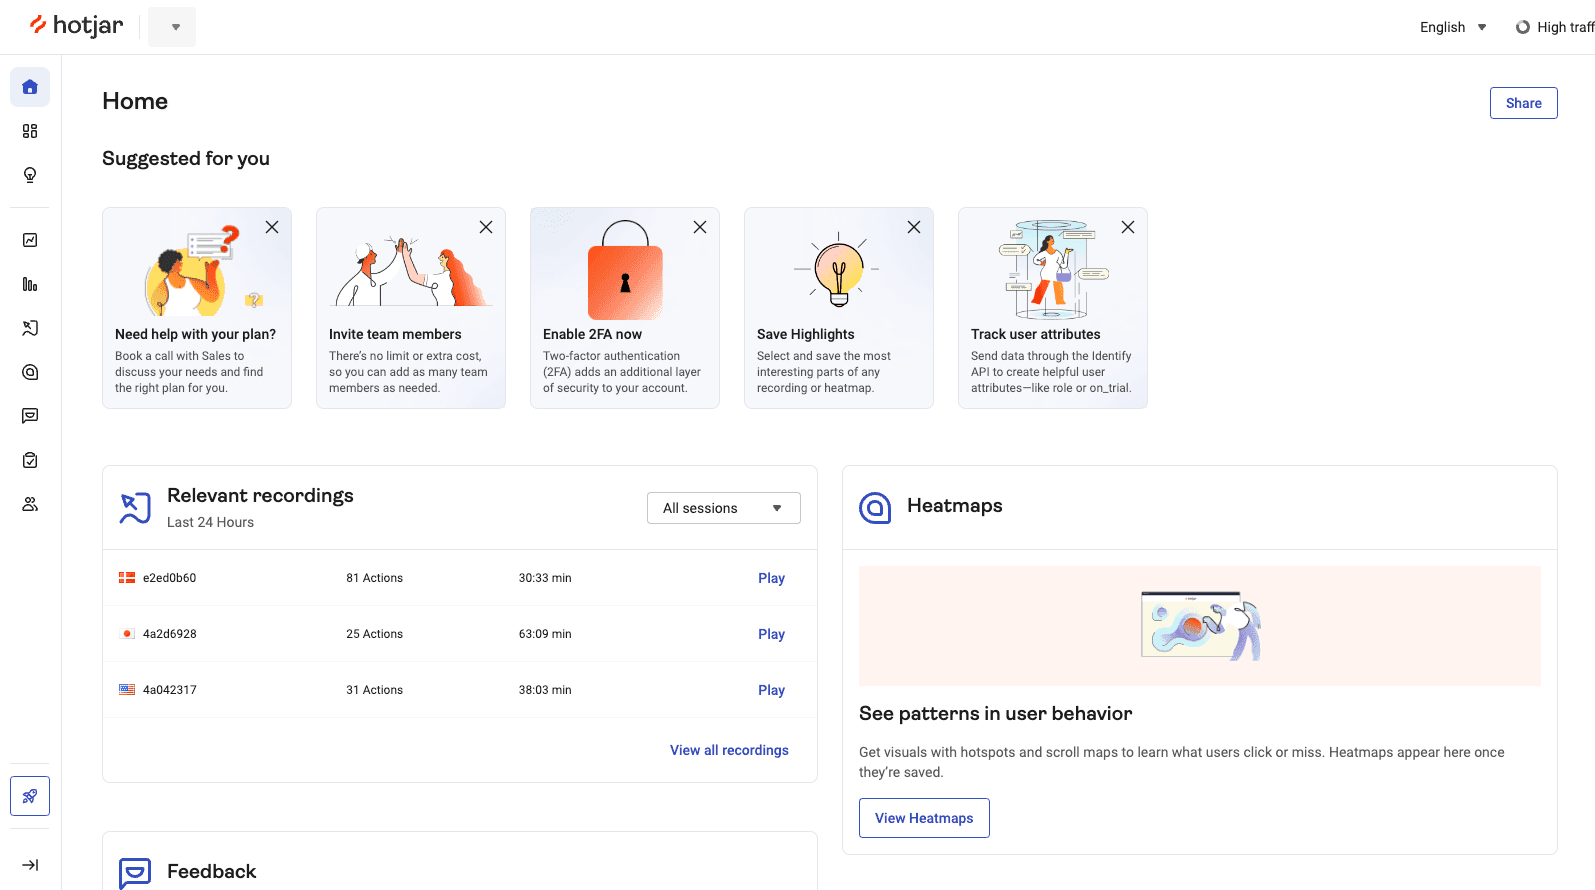
Hotjar
Hotjar has a range of features to help you view how a user behaves on your site so you can understand its impact on your customer's experience. One of its key features allows you to record a user's individual sessions on your site to view how they navigate and if they encounter any stumbling blocks or bugs. The platform also lets you view heatmaps, showing where users click, move, and scroll on your site, highlighting areas that attract users or go unnoticed. It also allows you to collect user feedback through polls and surveys.
Mixpanel
Mixpanel is an analytics platform focusing on user interaction with web and mobile applications. It provides key insights into user actions, enabling you to see how customers behave on your site and areas needing improvement. It also provides funnel analysis, A/B testing, and user segmentation, which can help you identify what drives conversion, engagement, and retention. This targeted analysis helps you to personalize your user engagement and pinpoint areas that may be causing users to drop from your site.
Final Thoughts
Everything is going digital, and these days, you’re not just competing against your competitors; you're competing for your customers' attention. Web analytics are a critical component to understanding your customers. If you’re interested in learning more about how you can capture web analytics to supercharge your user experiences, book a demo with one of our solution engineers today to learn how Hightouch can help.