Today, we’re launching sync logs, a new observability feature that lets you analyze important data about your Hightouch syncs directly in the warehouse. In a few clicks, you can enable sync logs in Hightouch and jump back to your warehouse to debug errors, identify trends, and ultimately improve the performance and reliability of your models and syncs—all from the comfort of the data warehouse and with the flexibility of SQL.
This expands on our already best-in-class observability features, giving engineers the insights they need to troubleshoot, debug, and improve their data pipelines.
Observability with Hightouch
Data engineering and business teams alike rely on Hightouch syncs to power their critical business apps. And when there’s a problem with a sync, it's imperative to quickly pinpoint and resolve the issue so that everyone has confidence in the data. Anything less means inefficient ad spend, missed sales quotas, or out-of-date metrics shared with the board.
Enter: observability.
As consumers of many SaaS tools ourselves, we’ve grown weary of platforms designed as black boxes that generate important data but which offer little transparency under-the-hood. We believe SaaS products should be as easy to observe and debug as if you had built them in-house. This is why we offer a suite of observability features designed to help you understand, debug, and improve your syncs:
- The live debugger is a native feature of our platform that makes it easy to get visibility into the requests and responses of a particular sync run. You can dig deeper into unsuccessful runs and resolve errors at the code level or you can filter and search across rows to pinpoint issues faster. Important to note: we don’t store any customer data on our servers, and we don’t want to. That’s true for our live debugger, too. Instead, the data is sent directly from your warehouse to your own S3 bucket, which then powers our app through our secure hybrid architecture.
- To help you stay ahead of potential data pipeline issues, we also offer configurable alerts and support notifications through SMS, Slack, email, and PagerDuty. You can choose your alert channel and define the number of row failures that would merit a notification.
- The promise of observability is to shift engineering from reactive to proactive behaviors, and observability platforms like Datadog were founded to make this vision a reality. Our Datadog integration brings proactive anomaly detection and dynamic dashboards to your sync data so you can stay one step ahead of potential issues and continuously optimize your data pipelines.
We’re proud of the observability toolset we’ve built…but there’s been a glaring gap: much of that useful sync data has been siloed. Until now.
Bringing it back to the warehouse
We believe that everyone should work in the tools they love, and for data engineers that's the data warehouse. It’s the north star behind why we built Hightouch in the first place: get data from where it already lives and sync it directly into the business tools that your teams rely on. Without building splintered databases, custom APIs that inevitably break, or multiple sources of truth.
We’ve had a debugger in our app for over a year, and our customers love that it lets them “look under the hood” of Hightouch and inspect particular APIs to resolve errors. But all of that important data is only accessible in the Hightouch platform, which is a drawback for a few reasons:
- You forgo the flexibility of SQL for more complex data analysis
- You can’t do longer-term trend analysis
- You miss the context of all your other customer data
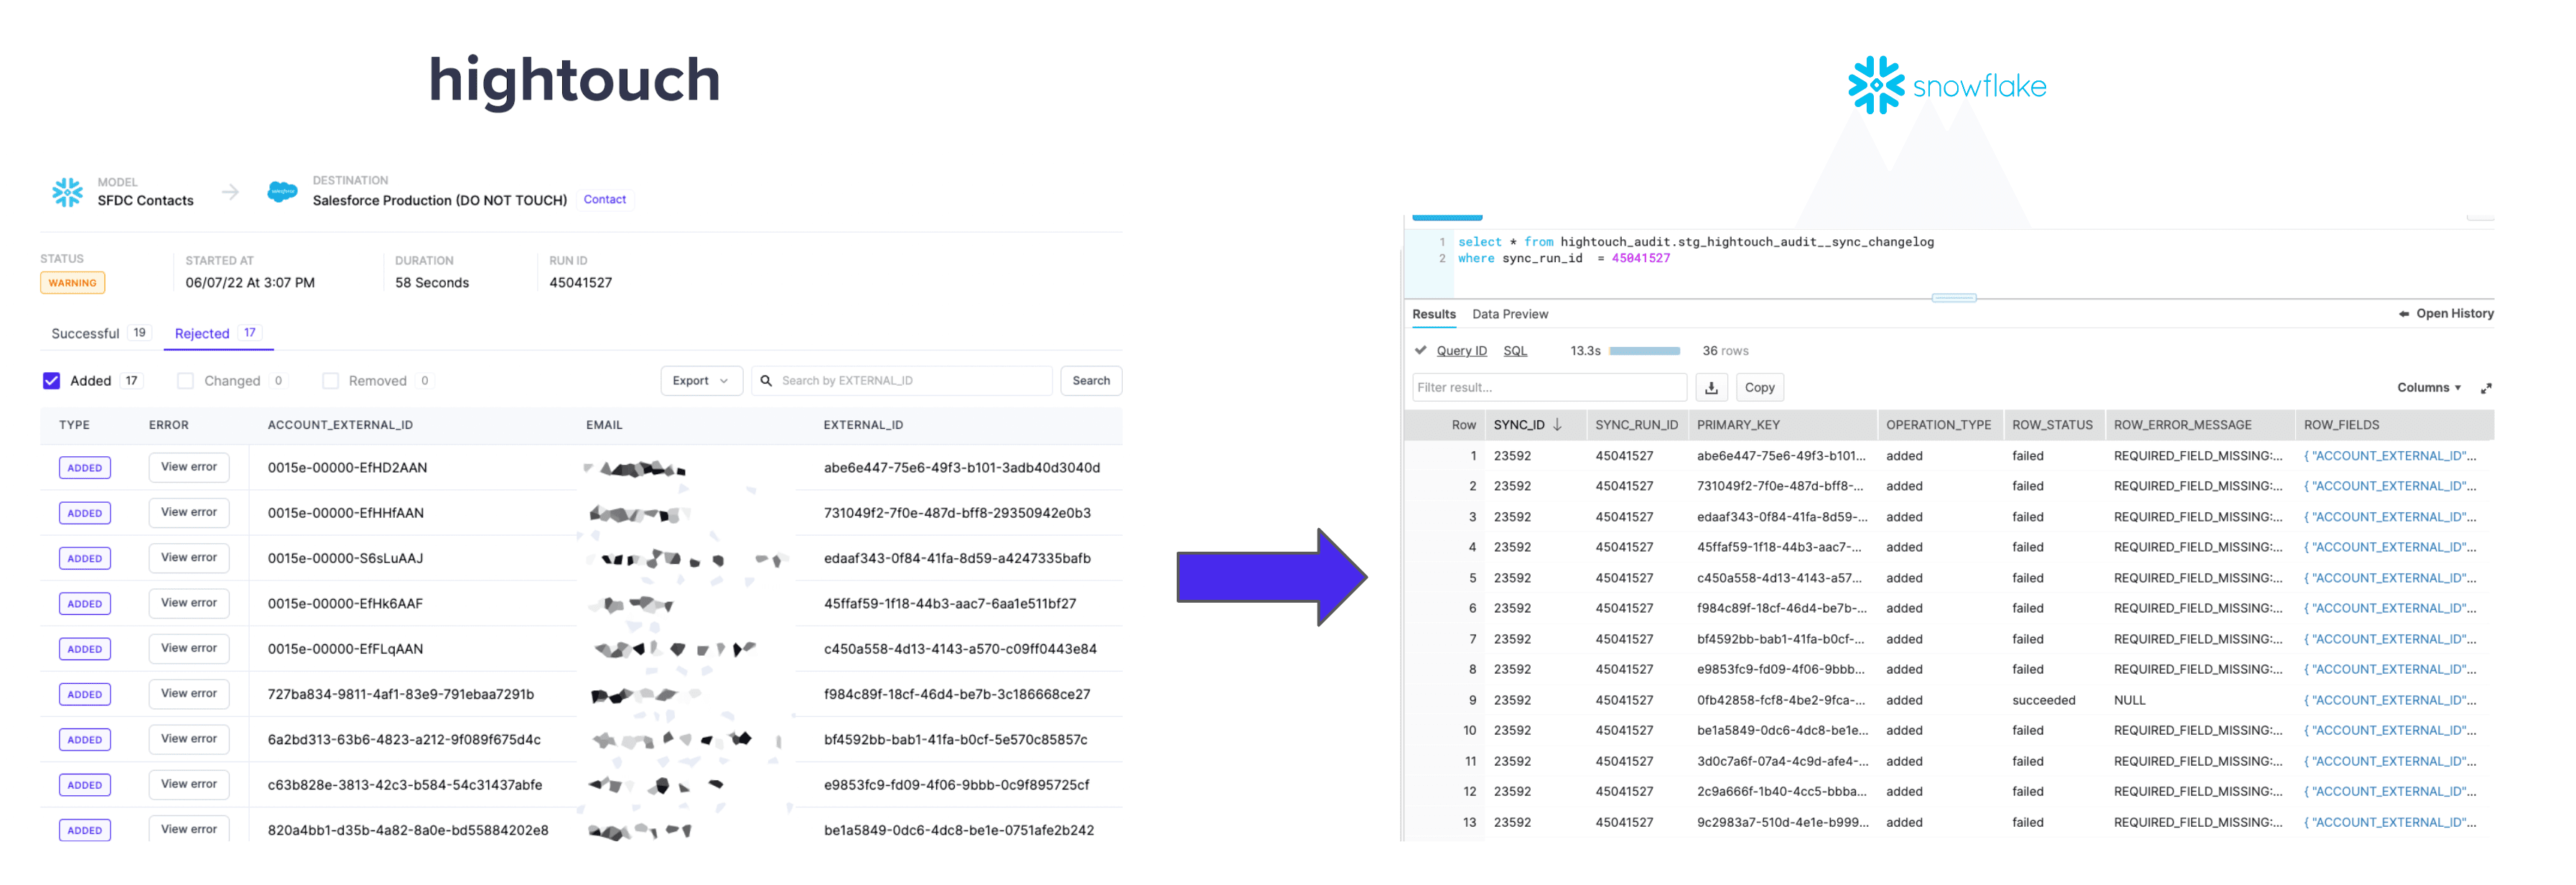
Sync logs unlocks important data that previously existed only in the Hightouch app and writes the data back to your warehouse—where you can dig deeper into trends, errors, or insights with the full flexibility of SQL. From there, you can tackle more advanced debugging use cases like finding the most common errors by sync or customer segmentation use cases such as determining entrance and exit events of customer cohorts.
Taking it a step further, we believe data should never be locked in vendor tools; your metadata should live in your warehouse where it can be analyzed and joined as part of your existing workflows. Sync logs does just that.
Unlocking new troubleshooting use cases with sync logs
Here’s how it works: Once the sync log metadata is written to your warehouse, it’s really easy to start querying against it and even to explore the data using your favorite BI tool. We’ve written a helpful dbt Package to make it easier to get started.
The models in this package help solve common use cases and demonstrate some typical query patterns we’ve seen. For example, if you wanted to know the first time a row was inserted in a destination, or figure out exactly what fields changed for a particular primary key between two runs, the dbt Package makes it that much simpler to do.
Here are a few problems our customers are solving with sync logs:
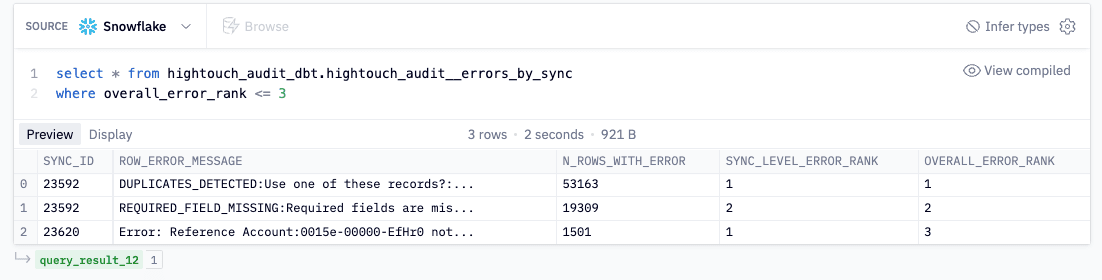
1. Find the most common error by sync
Apply the 80/20 rule to your debugging efforts. In the query below, you can see that on Sync ID 23592, duplicates were detected over 53,000 times. Now you know how to improve the logic of your sync or model and resolve the error going forward. Sync logs provide a scalable and efficient way to spot and error check so you can make sure that common errors aren’t being missed.
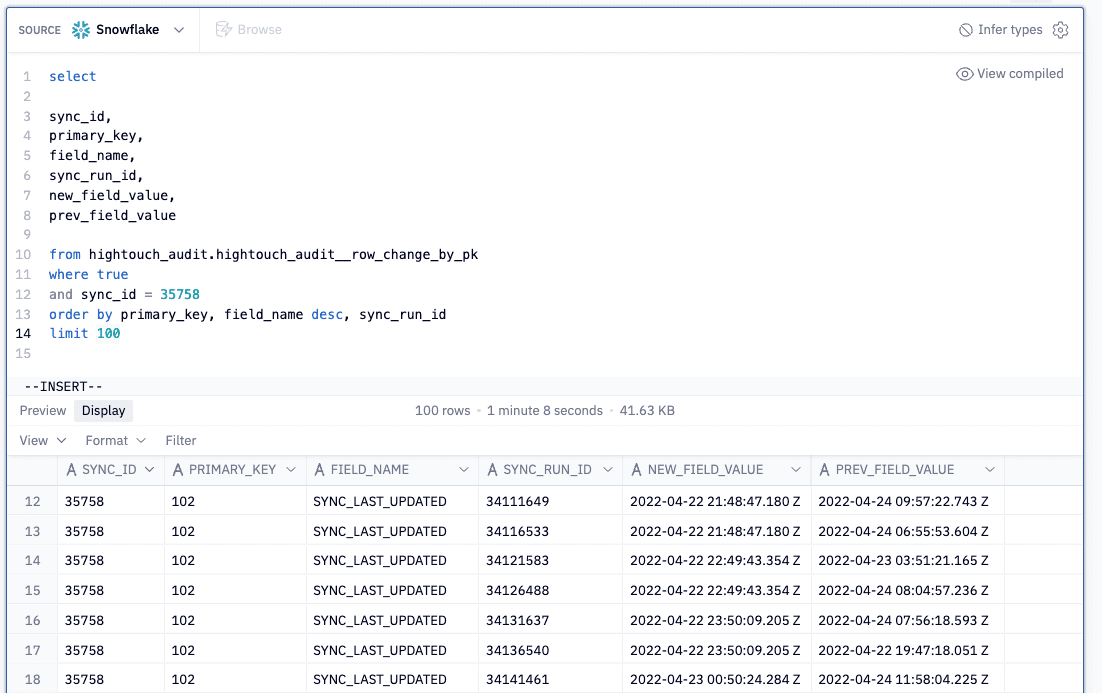
2. Determine what changed between two runs
You may want to know why a particular row was updated in your destinations. Something about the row changed but you’re not sure what. Instead of spot-checking hundreds of columns, you can write a simple query that takes advantage of our dbt models to find exactly what changed for each row and field synced to the destination. For example, below you can see that for sync 35758, the SYNC_LAST_UPDATED field changed a number of times for a given row. If you wanted to reduce the number of syncs, you could try casting the field to a date instead of a date-time, as an example.
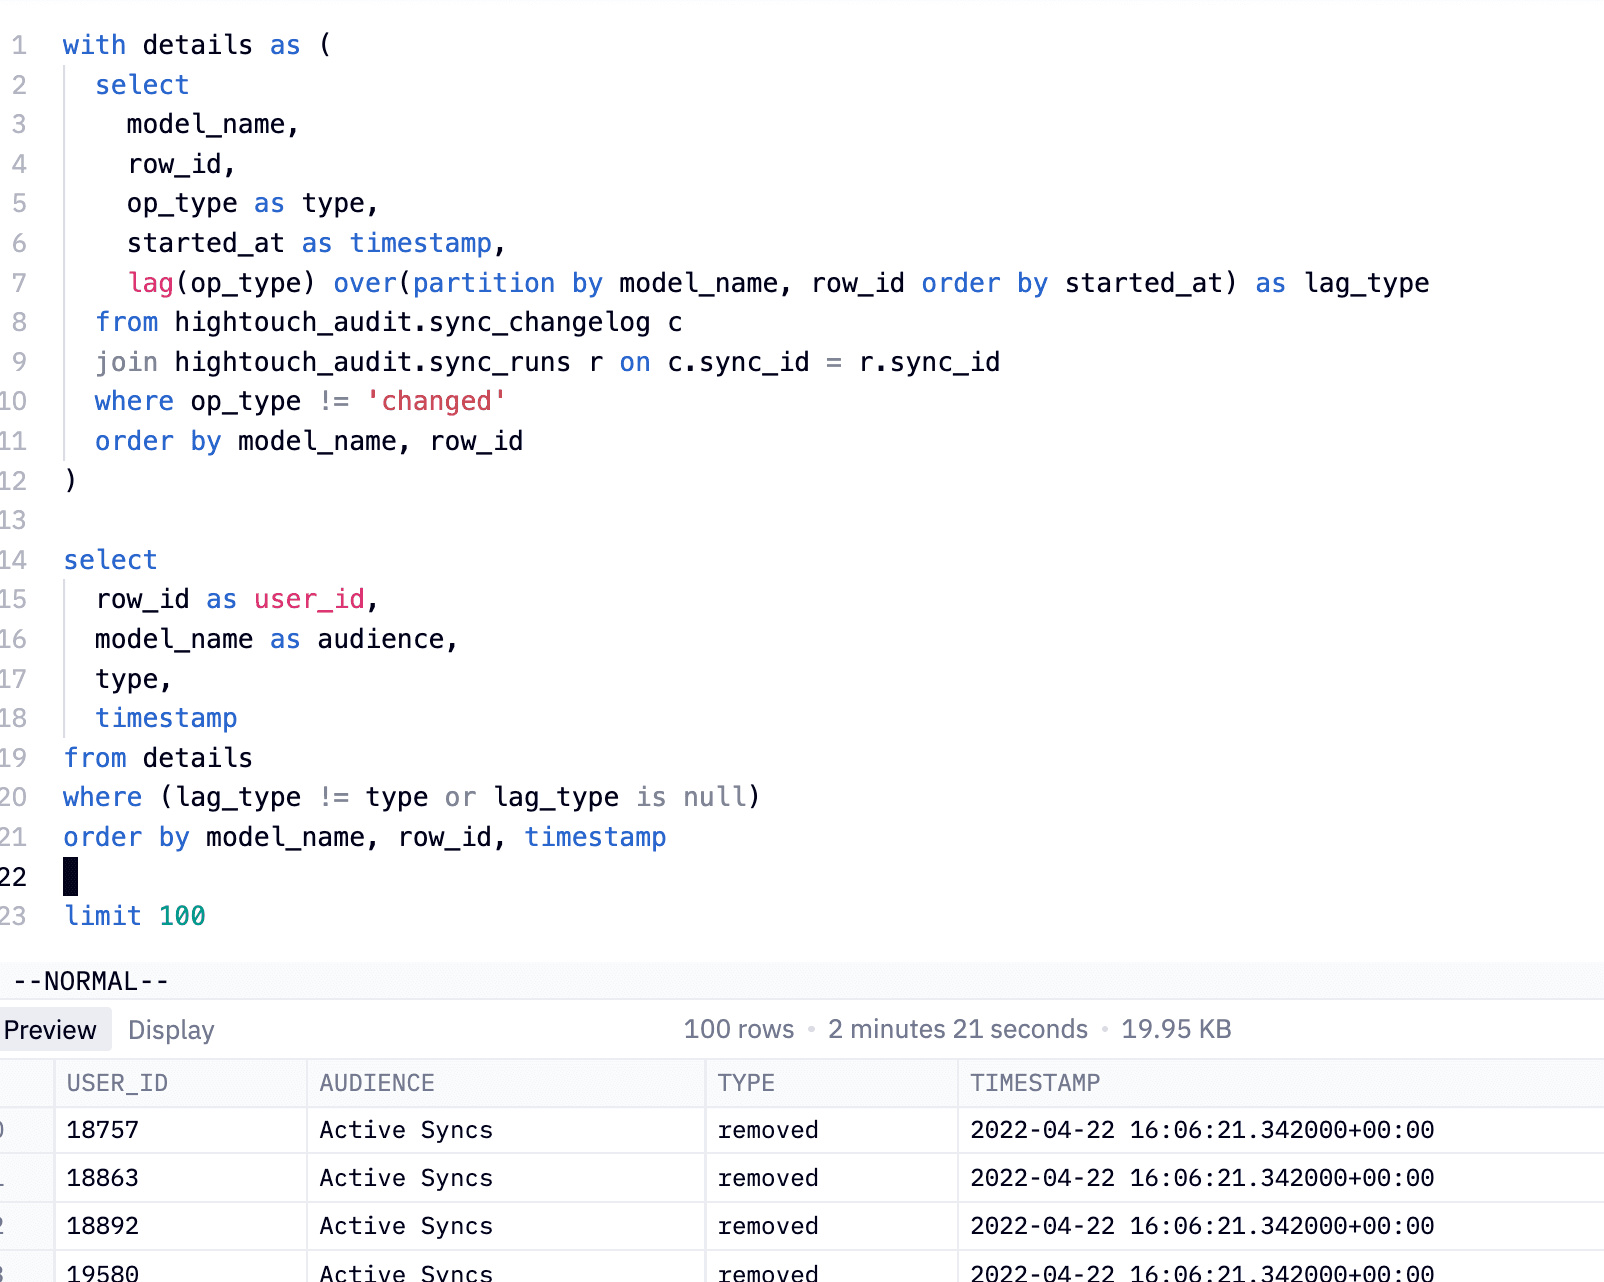
3. Understand Audience entry/exit events
For sales or marketing campaigns, it may be useful to understand exactly when a particular user first entered your system. You can filter to the user you care about and quickly search across all of the runs that were ever executed to see exactly when that user entered the model. From here, you can do all sorts of interesting cohort analysis, or understand the efficacy of particular campaigns.
The example below shows all the times a user was either removed or added from a model using SQL to look back on previous operations. This demonstrates the power of having your metadata in the warehouse. The full power of SQL means nearly any question you have can be answered.
“With sync logs, we can correlate failed sync rows with our other customer data to quickly detect the error—all without context-switching between environments. We have used these insights to update a model to filter out rows that previously failed, improving our data quality and reducing data transfers.”

Michel Ebner
Data Engineer
But wait, there's more!
Here's a quick video of Pedram, our Head of Data, giving a quick overview of a few of these use cases in action, starting with setting up sync logs in Hightouch and using the dbt Package to tackle some common use cases even faster. You can also find these use cases and more in our public Hex notebook.
We’d love to hear from you about the use cases you're able to tackle with sync logs! Shoot Pedram an email (pedram@hightouch.com) or submit a pull request in our public repo to share.
Start logging your syncs today!
Check out our Docs to get started logging your Hightouch syncs in your warehouse. Don’t forget to check out our dbt Package to get started with common use cases even faster. If you’re not a Hightouch customer yet, you can sign up for a free account.