Data that you can’t trust is worse than no data at all. That’s why we believe that data teams should treat their pipelines with the same rigor that they treat production code. Most recently, we launched Git Sync, which allows you to audit and version control your syncs. With our new Datadog integration, you can now create highly customized alerts and dashboards for your syncs.
This lets you know immediately if your data isn’t flowing as expected. And you can define for yourself what your business cares about the most when it comes to “sync health”.
Read on for the highlights, or add your Datadog API key to see it in action!
Designed for flexibility
While we do provide in-app alerting, some customers require even more customized alerting. For example, one customer uses Hightouch for operationally critical data, and needs to be notified as soon as errors happen (even if the overall sync is still processing). Another customer needs to make sure no rows are unnecessarily resynced to minimize their Braze datapoint usage.
We considered building this functionality directly into Hightouch, but decided to export the data into a 3rd party tool custom build for this use case (Datadog) instead for two reasons:
- Customers gain the full power of Datadog because it has anomaly detection and great dashboard support.
- By exporting raw data, customers can create customized alerts that we don’t have to explicitly design for in-app.
We settled on exporting a small set of base metrics that matter for Sync health. When combined with Datadog’s tag filtering, you can build a surprisingly large amount of customization on top! Here’s some key metrics that we expose:
- hightouch.sync.row_processed — These metrics are incremented each time a row in the Sync is processed. It includes tags for whether the row successfully synced. This is helpful for building custom error thresholds.
- hightouch.sync.sync_complete — Tracks the overall Sync status of the entire run. This is helpful for getting a summary of overall sync health.
- hightouch.sync.total_time — Tracks how long the entire sync took. This is helpful for noticing sync slowdowns.
Example use cases
Alert immediately if any row fails to sync
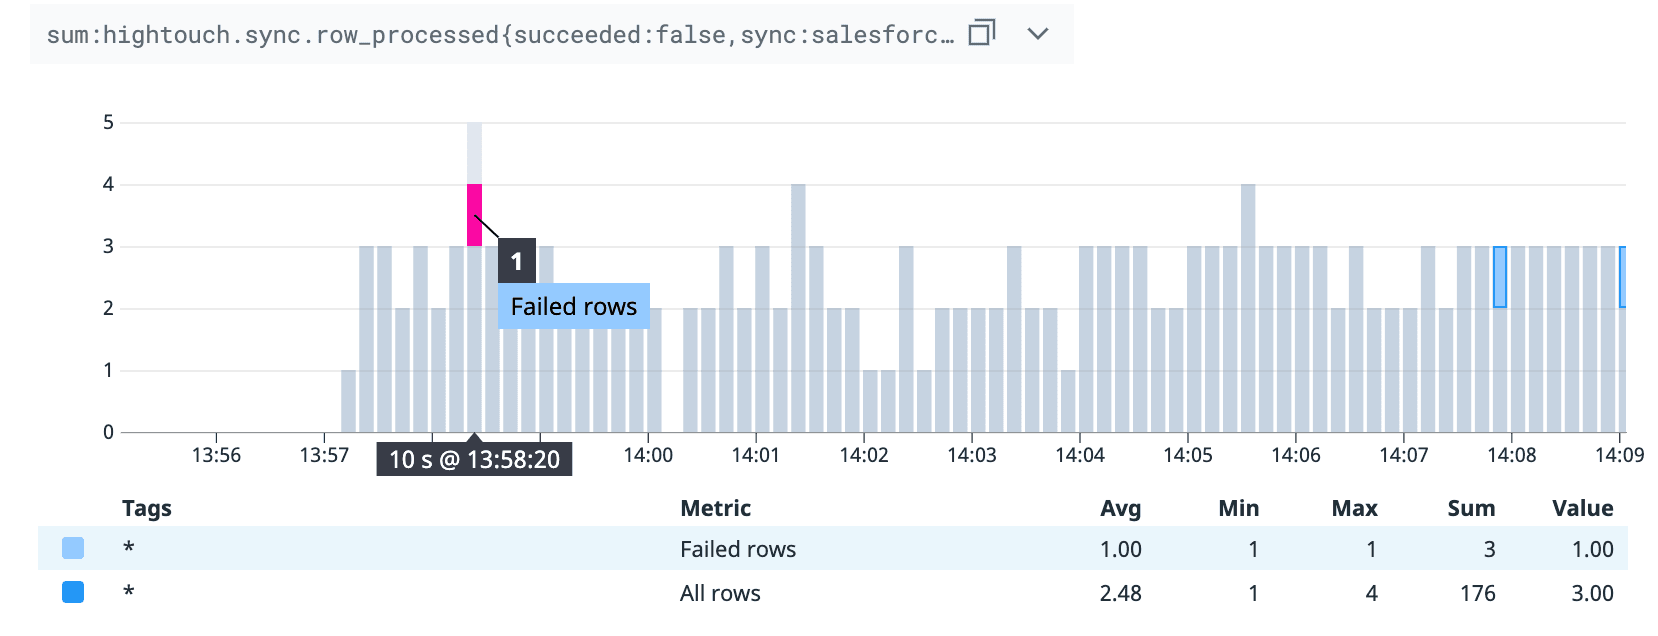
Because we emit row_processed events as they happen, any relevant alerts fire immediately, even if the sync is still processing
In this sync run, a failure within the first ten rows triggered an alert. This event was immediately exported to Datadog, even with hundreds of rows still left to process in the Sync.
Alert if a Sync Hasn’t Run In More Than a Day
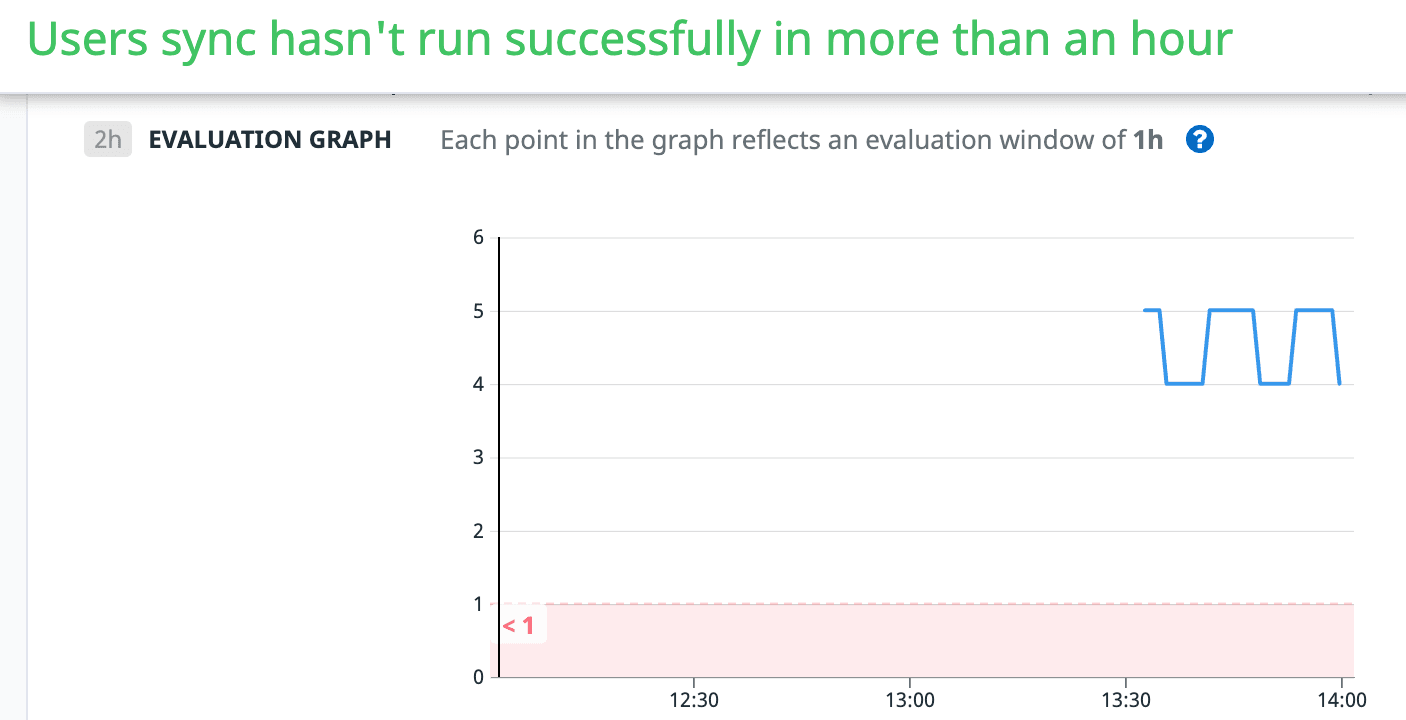
Let’s say you have an awesome data pipeline that ends with triggering Hightouch via Airflow. What if you had a bug somewhere that resulted in the Airflow job not triggering? You might not realize it until you get an angry Slack message from someone that relies on it. No one wants that!
This example alert fires if the user's sync hasn’t run in more than an hour. It works by counting the number of sync_complete events in the past hour and making sure the sum doesn’t dip below one.
Alert if a Sync Run Detects an Unusual Number of Changed Rows
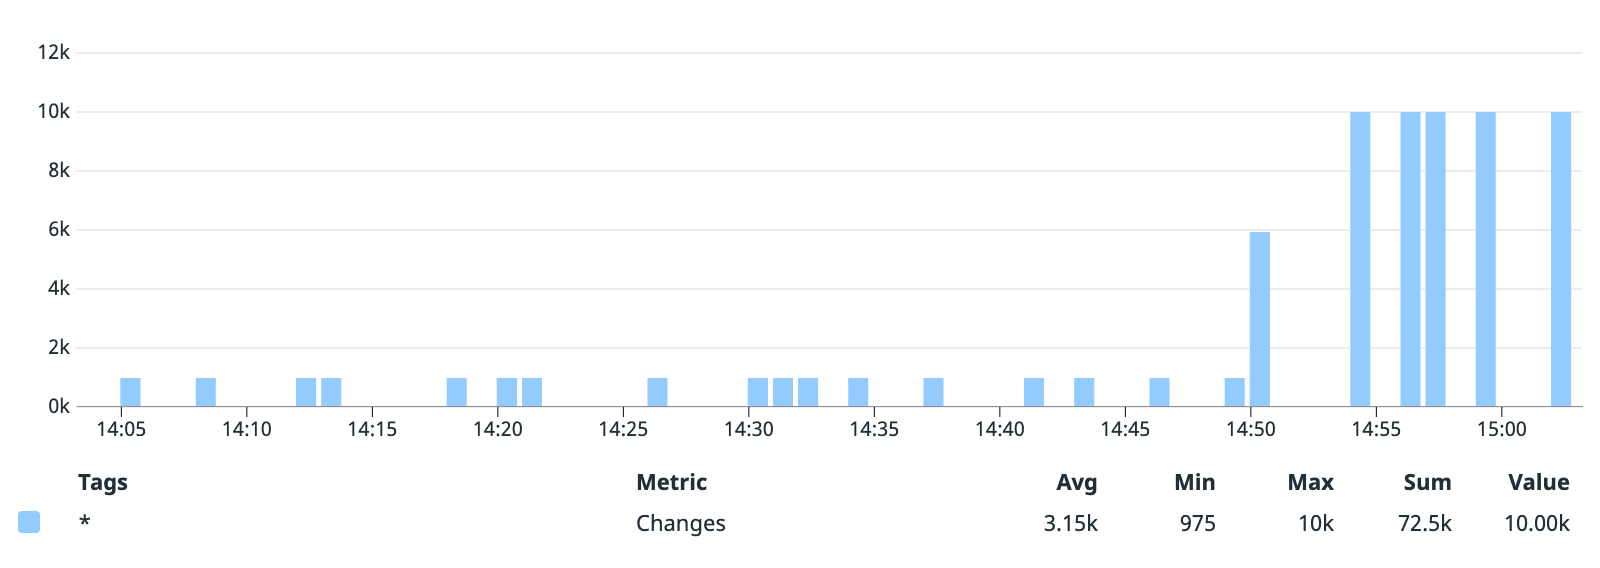
Imagine that you’re syncing data to Braze, and want to make sure you don’t use up all of your data points (credits) with unnecessary API calls. This can happen if the data in your model unnecessarily changes, resulting in Hightouch resyncing the affected rows. For example, you might be syncing an array, where the internal ordering changes from run to run (but the values themselves remain unchanged).
In this example, the number of changed rows is usually about 1,000 per run. However, a query change triggered about 10,000 changes, so we got paged!
Alert if Syncs Are Getting Slower
This is our personal favorite use case since it helps us on the engineering side 🙂.
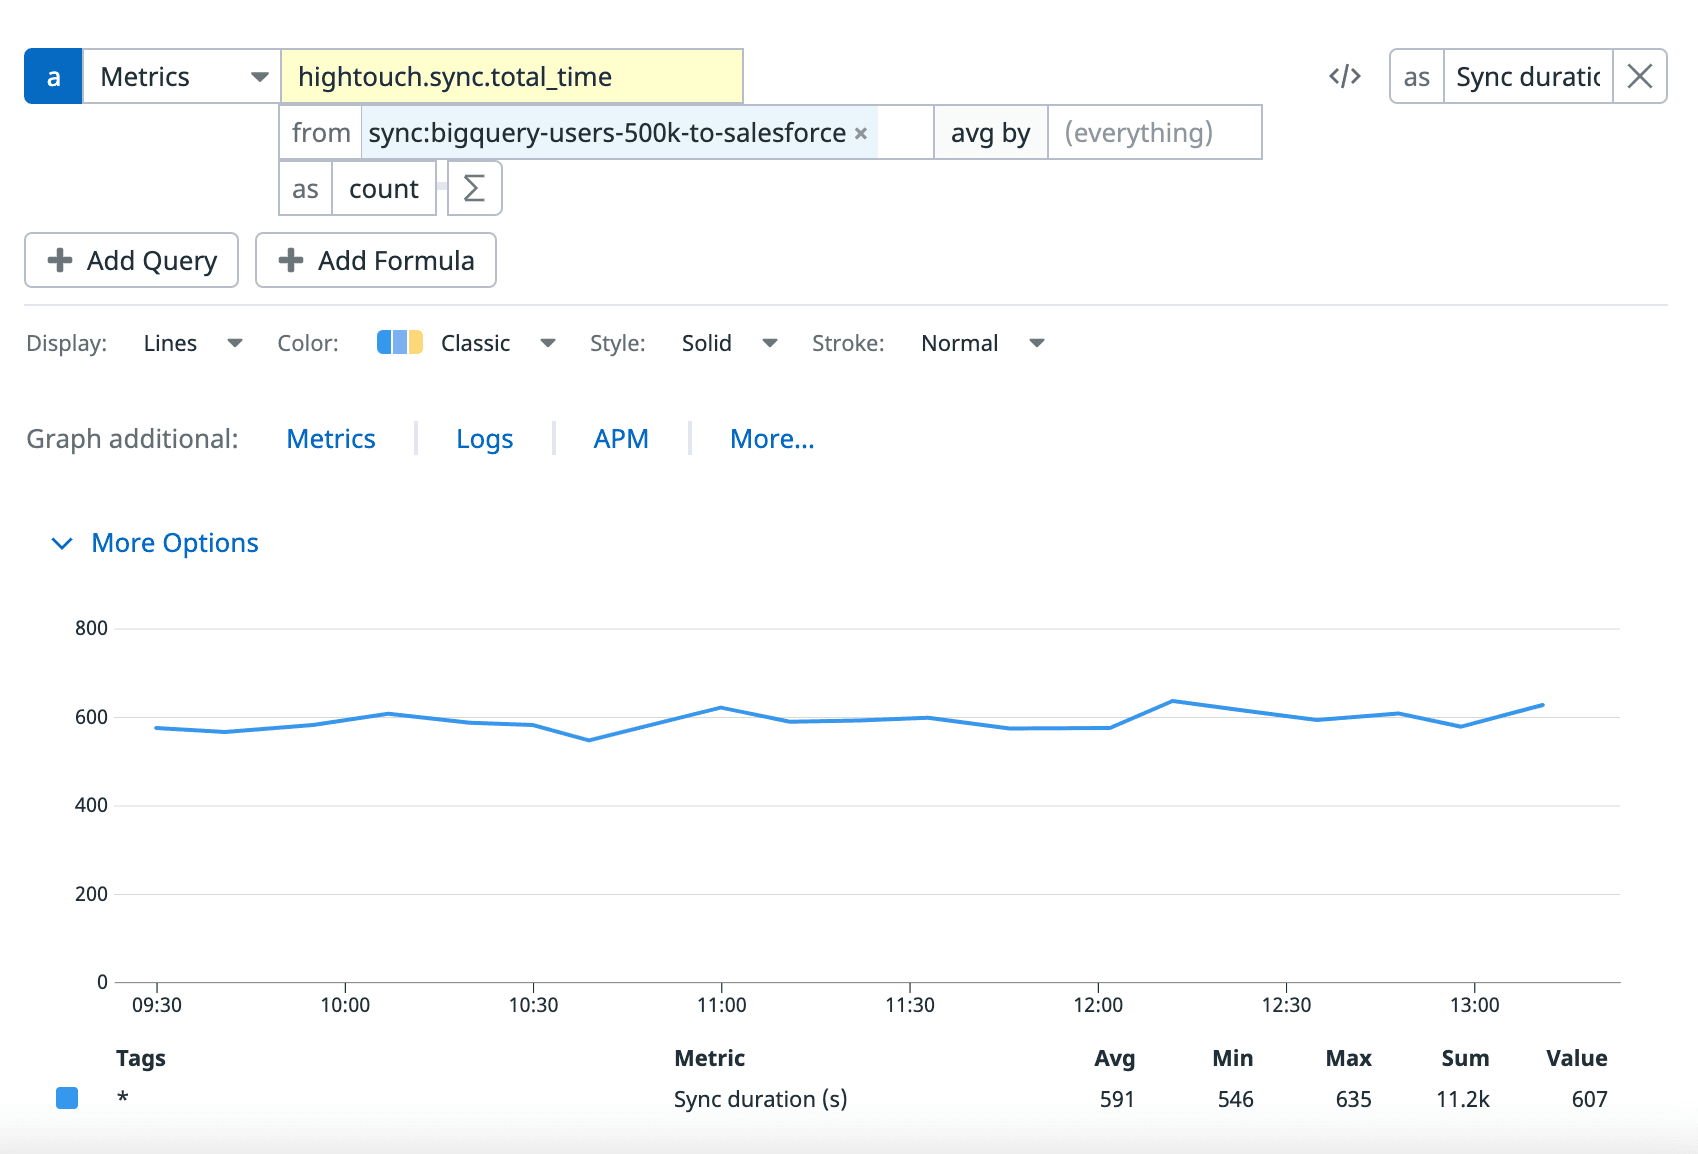
Internally, we have a workspace that continuously runs end-to-end tests at scale. We hooked up a Datadog alert that fires if the sync gets slower (using Datadog’s anomaly detection system.) With this alert, we know immediately if we pushed a change that slows down our syncing pipeline.
Here, you can see that we consistently take about 10 minutes to sync 500,000 users to Salesforce.
Our First Use Case: Anomaly Detection on Failures
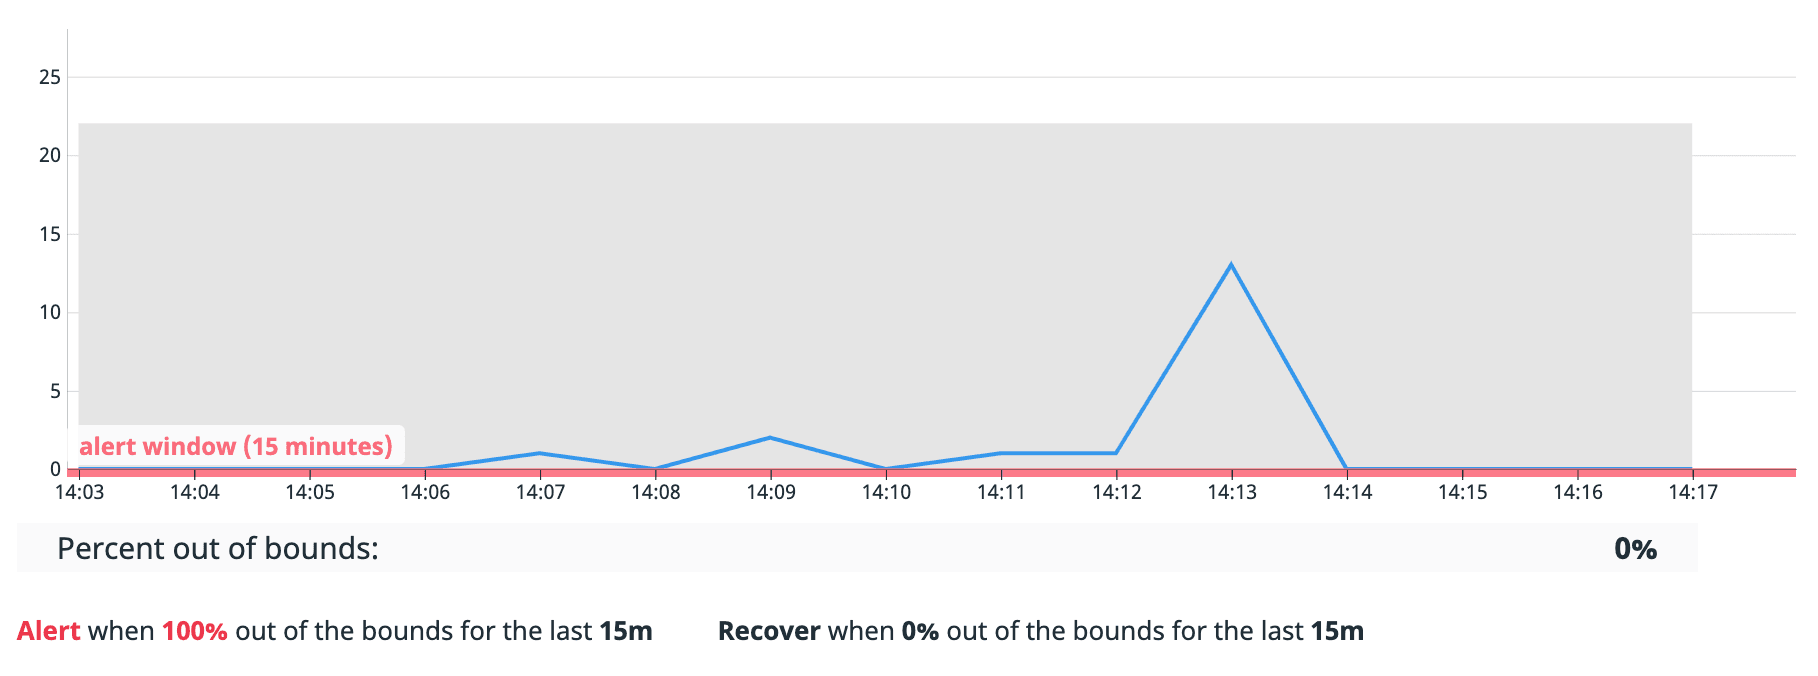
As soon as we released the integration, we set it up internally on our conversion events Sync. This sync is tricky since we expect it to have some failures due to invalid email addresses, but it’s hard to define exact thresholds. With Datadog’s anomaly detection, we set up an alert that fires if there is a meaningful spike in Sync errors.
What’s next?
We have lots more planned on supercharging observability into your syncs. Soon, you’ll be able to access this data (and more) directly in your warehouse and unlock use cases such as:
- Categorizing failed rows to figure out what errors are most common
- Analyzing which rows are changing the most
- Visualizing sync performance over time in BI tools
Get in touch if you’d like early access to in-warehouse visibility!
Try it out!
The Datadog integration is out in all Hightouch workspaces. To get started, you just need to enter your Datadog API key, and your syncs will automatically start sending metrics to your Datadog account.
Let us know if you need any help getting started, or would like us to integrate with other monitoring tools!
Let us know if you need any help getting started, or would like us to integrate with other monitoring tools!


