Introduction
In December 2020 the first ever Coalesce conference was organized by Fishtown Analytics, the creators of dbt. The conference consisted of a bunch of sessions mostly given by and directed to Analytics Engineers.
One session, in particular, sparked lots of discussion on the dbt community and gained a lot of interest from many of the ~4000 attendees —Kimball in the context of the modern data warehouse: what's worth keeping, and what's not by Dave Fowler, CEO of Chartio.
"Kimball" here refers to Ralph Kimball’s Dimensional modeling that was described in the Kimball Toolbook which was in its 3rd edition 15 years ago. The ideas proposed by Ralph Kimball have been the basis for data warehouse modeling and architecture for a long time, until today.
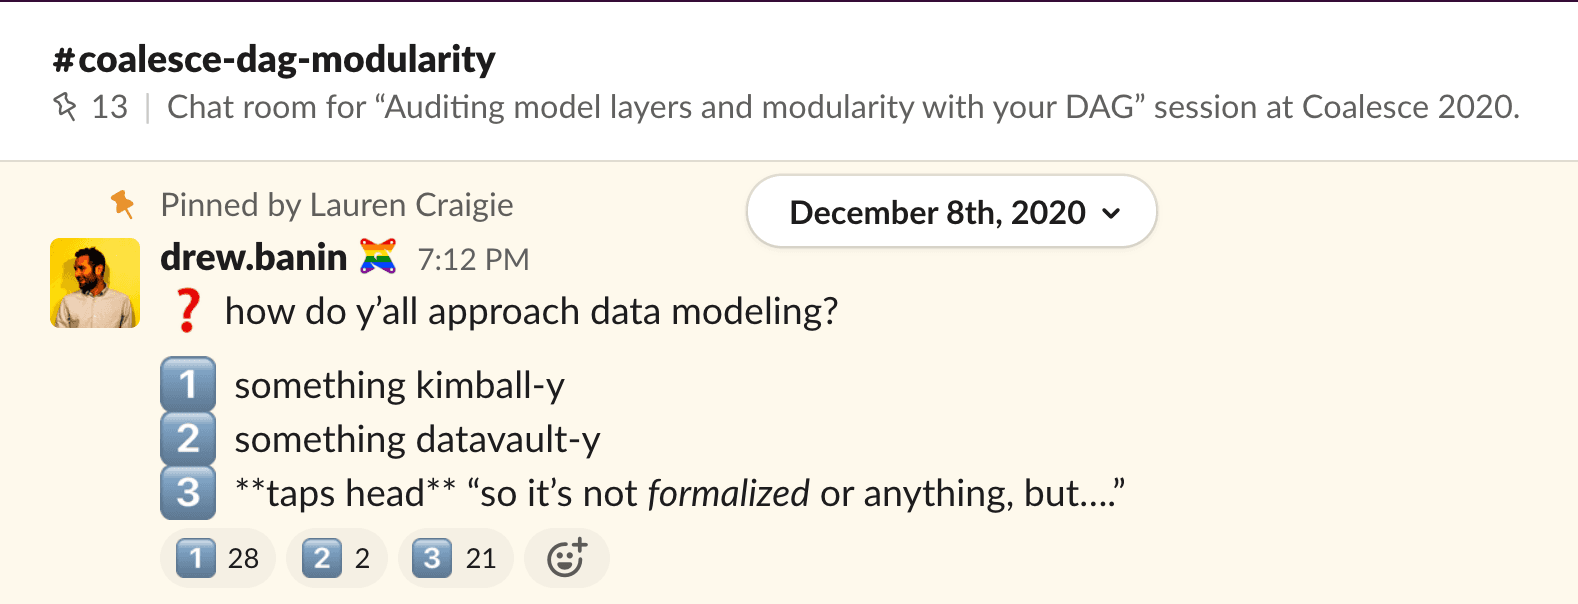
The session was about reevaluating one of the most adopted modeling paradigms given that cloud data warehousing technologies (which debuted after the book was published) have solved many of the challenges that were discussed in the book.
My goal is to offer objective recommendations and share best practices related to data warehouse modeling and at the same time, shed some light on the preferences of other data people with strong opinions about warehouse modeling and explain some of the modeling terminologies mentioned in discussions like (Star Schema, Kimball, Dimensional model, Fact and Dimension tables, OBT, Wide tables, Wider tables, Data Vault ..etc).
This article should be a great starting point for anyone who has suddenly found themselves in charge of administering a warehouse without having solved the problems that appear in different models before.
Raw data schema
Gathering data from different sources
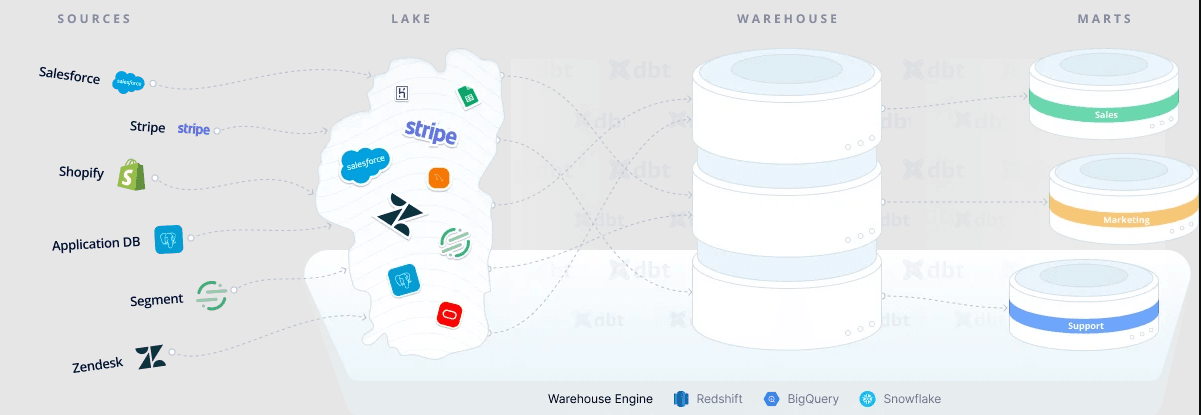
Before discussing the ideas mentioned in the session and the community discussions, let’s look at how to get the data from various sources into the data warehouse. Usually people opt for third-party tools like Fivetran and Stitch to fully manage syncing identical copies of data from different types of sources like Products databases, Event trackers and SaaS tools into the Data Warehouse without any data transformation taking place.
The term "Data Lake" refers to an area where raw, unstructured data from various sources is dumped prior to being transformed for the purpose of loading data into a warehouse. The most popular data lake is Amazon S3, but with the rise of cloud data warehouses that separate storage from compute, staging tables/schemas inside of the data warehouse itself can serve the purpose of a data lake.
The Data Lake is usually a schema in the currently used Cloud Data Warehouse technology like Snowflake, Bigquery and Redshift, or in case of unstructured data (like images used to build machine learning models) things like Amazon S3 or Delta Lake are used.
Examples of Raw data tables
To look at some examples of how raw structured tables in the data warehouse will look like, we will assume that we have the following tables coming from our sources:
Events Table from Mixpanel for example, tracking how users are interacting with our app:
| id | name | time | properties |
|---|---|---|---|
| 1 | sign_in | 2/3/2021 | {“user_id”: “12345” } |
| 2 | purchase | 2/3/2021 | {“user_id”: “12345”, “item_id”: ”3456”, “order_details_id”: “789” } |
| 2 | purchase | 2/3/2021 | {“user_id”: “12345”, “item_id”: ”3456”, “order_details_id”: “789” } |
| 3 | signaccount_created_in | 4/4/2021 | {“user_id”: “54321” } |
Notice that:
• The purchase event of event_id = 2 was fired twice by mixpanel.
• Also the event properties column is unusable to us since it is in the form of a JSON blob
• The order details and item details are stored in other tables and we cannot use this table alone for most business needs
Users table coming from the products’ Postgres database:
| id | name_first | last_name | age | country | insertion | premium | address_id |
|---|---|---|---|---|---|---|---|
| 12345 | Kareem | abdelSALAM | 25 | 1 | 1/1/2021 | 0 | 1 |
| 54321 | John@ | doE | 322 | 2 | 2/1/2021 | 1 | 2 |
| 34251 | Lisa11 | Cuddy | 38 | 3 | 3/1/2021 | 1 | 2 |
Notice that:
• Columns are poorly named and inconsistent
• The name columns have non-alphabetic characters, leading and trailing spaces, and bad casing
• The age column has an invalid age (322)
• The country column has hard to interpret values and needs a lookup table
• The insertion column that represents when the user was added to the database is poorly named
Although a lot of cleaning processes obviously need to be run on the tables above, we will still sync those tables with their unusable values into the “Raw” database/schema in the data lake.
Why You Should Adopt a Composable CDP
Read our whitepaper to learn how you can implement a CDP in days instead of months.


Staging
Making the sources more usable
Now that all our sources are available in the data lake it is time to start the T in ELT : Transformation.
The Staging schema is a place to do column renaming, deduplication, JSON extraction, trimming leading and trailing spaces and other light transformations to make the data more usable. It is more like a bath and shave for the data as I once read. No major transformations there, usually the staging tables/views will have 1:1 relationship with the raw sources in the data lake.
Now, let's take a look at how the source tables will look like in the staging space.
Mixpanel events table:
| event_id | event_name | event_at | user_id | item_id | order_details_id |
|---|---|---|---|---|---|
| 1 | sign_in | 2/3/2021 | 12345 | NULL | NULL |
| 2 | purchase | 2/3/2021 | 12345 | 3456 | 789 |
| 3 | account_created | 4/4/2021 | 54321 | NULL | NULL |
Notice that:
• The columns are given better names (id : event_id, name : event_name, time : event_at)
• The table is deduplicated and the event of event_id = 2 is no longer happening twice and consequently will not be double counted in reporting
• The JSON blob is extracted into columns so that we can join the table to other tables to get the needed ‘dimensions’/features
• Table name in warehouse is for example: stg_productname_mixpanel_events
Postgresql table of users :
| user_id | first_name | last_name | age | country_name | inserted_at | is_premium_user | address_id |
|---|---|---|---|---|---|---|---|
| 12345 | Kareem | Abdelsalam | 25 | Egypt | 1/1/2021 | False | 1 |
| 54321 | John | Doe | 32 | Germany | 2/1/2021 | True | 2 |
| 34251 | Lisa11 | Cuddy | 38 | USA | 3/1/2021 | True | 3 |
Notice that:
• Columns were renamed (id: user_id, name_first: first_name, insertion: inserted_at, premium: is_premium_user)
• The special characters, leading and trailing spaces and numbers were removed from name columns
• Proper character casing was done in name columns
• Ages outside normal range were handled with a well designed function (322: 32)
• Countries are now in a readable format (1: Middle Egypt, 2: Germany, 3: USA ..etc)
• The is_premium_user column now contains understandable booleans (0: False, 1:True)
• Table name in warehouse is for example: stg_productname_users
Those staging tables will act as the sources from now on, no raw tables should ever be used for building reporting/business layer tables, even if no transformations are done to raw tables it is always a good convention to make a staging view for each raw source. Adopting this method will save lots of effort changing sources of existing reporting tables if a transformation to raw data is decided later and prevents redoing the transformations multiple times for each use of the raw source tables.
Reporting models
Simple Metrics and Questions
Now that our data is cleaned in the staging schema, the next step is utilizing the clean sources which we have now to answer some business questions.
Our business users aren't concerned with source tables. They might want to answer questions like: what is the percentage of users in the USA of each age group who made purchases vs those who only created accounts and didn't purchase anything? Answering this question would require creating a new reporting table using the clean staged source tables and should look similar to this:
| event_id | event_name | event_at | user_country | user_age | item_name | order_price |
|---|---|---|---|---|---|---|
| 1 | sign_in | 2/3/2021 | Egypt | 25 | NULL | NULL |
| 2 | purchase | 2/3/2021 | Egypt | 25 | 50$ gift card | 50$ |
| 3 | account_created | 4/4/2021 | Germany | 32 | NULL | NULL |
Notice that:
• Some other columns and other dimensions are included in the table (like user_id, is_premium_user, other order_details columns ...etc) but only some of them are shown here to deliver the idea
• We can now report on any event type and calculate metrics like revenue, customer churn ..etc and show how much of these per age or country or other user features
Joining tables in BI tools
Luckily, We can perform joins inside BI tools like Tableau, Looker and Metabase which will give us a lot of the results we seek. However, it may need some level of database experience (which reports consumers usually lack) to know which keys to use for joins and what are the filters and conditions to use to get accurate numbers. Also, the modern cloud data warehouses are not big fans of joins, so if every time a user is viewing a chart, the BI tool has to instruct the data warehouse to perform a computationally expensive join operation: the users will likely have to wait several seconds for their insights to load. One solution to that is having Analytics Engineers build a view doing those joins and filtrations which will give business people something they can use.
Conclusion
In this article, we have introduced the first steps of structuring and modeling a data warehouse, these steps are considered the best practices so far by many brilliant Analytics Engineers and organizations. Aside from performance issues of making joins in BI tools or views, this still gives business people the numbers they are looking for in the shortest time. In the next article in the series, I am going to explain how more complex reporting needs are tackled. This involves explaining Kimball’s ideas (the Star Schema/ Dimensional model), Wide tables (also known as One Big Table) and some of the arguments that people presented to support each one of them. After that we may start explaining other models like Data Vault, Unified Star Schema and other models that may be useful in different business use cases.
Why You Need a Composable CDP
Read our whitepaper to learn how you can build a CDP on top your existing data warehouse.
- Why organizations are adopting a Composable CDP
- How a Composable CDP works
- Benefits of a Composable CDP


