Introduction
There are a lot of things to consider when modeling a cloud data warehouse: cost, performance, understandability, warehouse build time, speed of implementation for future reporting needs and model maintainability i.e. the Agility of the data model.
In the first article of this series, I mentioned Dave Fowler’s session from Coalesce 2020 that continues to spark lots of discussions in the modern data and marketing community. The first article paved the road to understanding the ideas discussed in this one.
As mentioned, the first two steps of building an analytics warehouse are: unifying customer data into a single platform and making it accessible for marketing teams to act on. We also discussed that those steps were usually enough to get some trivial business questions answered. However, stopping at this stage will only help answer a very limited set of questions and won’t allow one to unlock the true potential of our data layer, not to mention performance issues due to inefficient joins as discussed in part 1.
In this article, we’ll compare Kimball’s Dimensional model to the alternative paradigm that Dave supported in his session, namely “Wide tables”, as well as shed some light on interesting thoughts from the modern data and marketing community discussions supporting each model.
Combining data from different sources
A common request is making business-wide analysis from multiple data sources with different column structures and definitions. While we can always make charts that show metrics of each service separately, managers tend to use analytics to have a bird’s eye view of the whole business.
Moreover, building campaigns and reports for individual channels without a unified data foundation will likely result in duplicated effort and inconsistent customer experiences. For example, if there are two events tables for different products or platforms, we are going to copy the code to define a metric like “Customer churn rate” in the reporting tables of products.
Calculating the same metrics in different ways in the warehouse is a common trap that warehouse maintainers fall into. If the definition of a business rule is modified later, it has to be changed in all the tables, otherwise, reports will be inconsistent and consequently, people’s trust in the data team will fade. These issues motivated implementing models to unify data efficiently and centralize definitions of metrics.
Kimball
One of the most common solutions to the mentioned problems is following Ralph Kimball’s ideas with some alteration. Kimball motivated the dimensional model, which means dividing the core/business layer of the warehouse (which follows the staging layer) into fact and dimension tables.
Fact tables are like events that happened with a specific grain (set of features/dimensions) like time, location, user_id, application, etc and have foreign key columns pointing to these features.
Following the examples from my first article, the Mixpanel events table can already be used as a fact table where our facts are the events that happened. The following table, for example, is a union between two fact tables for the same product in two platforms (Android and IOS) to form a more centralized fact table that shows business-wide numbers.
| event_sk | event_name | event_at | user_id | item_id | order_details_id | source_app |
|---|---|---|---|---|---|---|
| f8r4rs | sign_in | 2/3/2021 | 12345 | NULL | NULL | android |
| j9u6fc | purchase | 2/3/2021 | 12345 | 3456 | 789 | android |
| s2c8mn | account_created | 4/4/2021 | 54321 | NULL | NULL | android |
| b6j5df | log_in | 2/2/2021 | 1478 | NULL | NULL | ios |
| e0e2xw | checkout | 3/3/2021 | 1359 | 3456 | 963 | ios |
| q1a4zi | create_account | 4/4/2021 | 2579 | NULL | NULL | ios |
Notice that:
• event_sk is called a surrogate key which is a unique identifier of each fact/event calculated from values in each row
• this table is a combination of the previously shown events table in the first article and another hypothetical one coming from another platform for the same product
• column names in the two source events tables could have had different names but unified here under one name
• the same item was bought by two different customers in two different applications and the purchase event name is not the same which indicates the reality that is unclean and inconsistent data
• A source_app column was added to identify which fact came from which application which is useful to make comparisons in reporting
• The fact table does not have to be modelled this way and this is just a clarification of what it may look like. Other decisions can be made such as combining similar events; for example sign_in/log_in = app_sign_in
Dimension Tables, on the other hand, are features to be added to facts to enrich them with more information and improve their filterability and grouping. The following example is the same as the users’ Postgres table in the first article but the *address_id *is joined with the hypothetical table of addresses, and replaced by values of the address from it.
| user_id | first_name | last_name | age | country_name | inserted_at | is_premium_user | address_street | address_building_number |
|---|---|---|---|---|---|---|---|---|
| 12345 | Kareem | Abdelsalam | 25 | Egypt | 1/1/2021 | False | Aboqeer | 123 |
| 54321 | John | Doe | 32 | Germany | 2/1/2021 | True | Fifth Avenue | 890 |
| 34251 | Lisa | Cuddy | 38 | USA | 3/1/2021 | True | Baker Street | 221B |
Notice that:
• The table name can be something like dim_users
• We can use these values to group and filter facts after joining
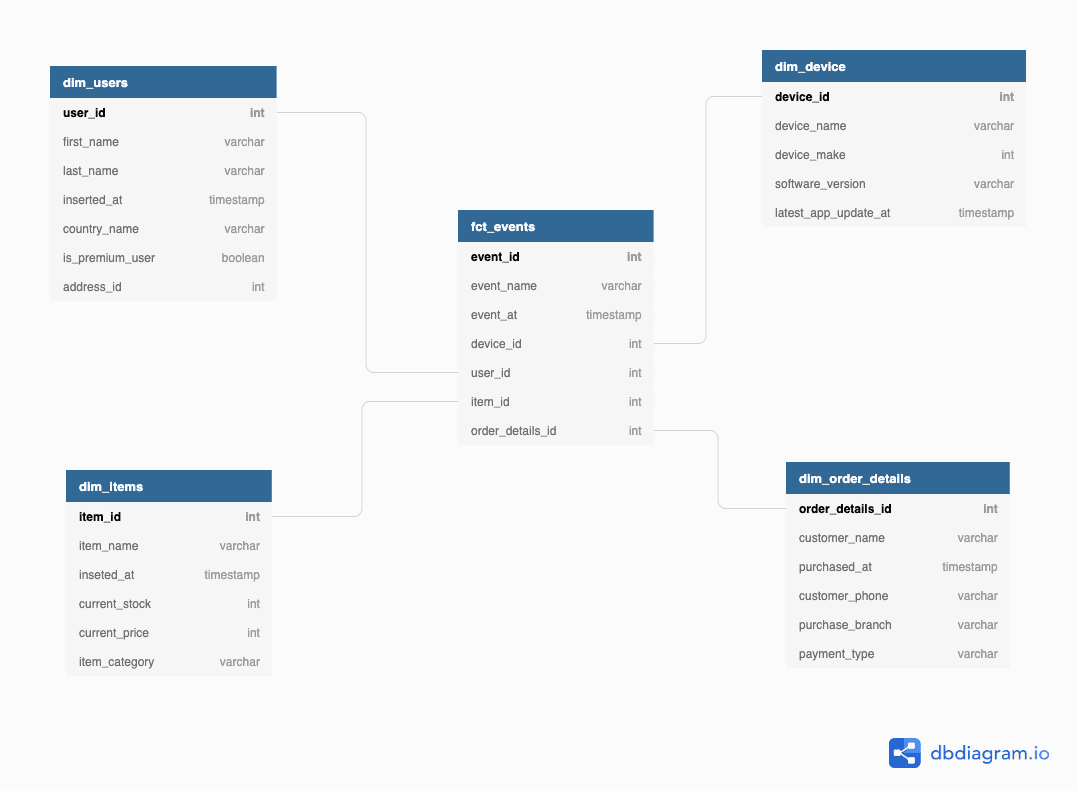
The Star Schema has fact tables as its core and the dimension tables have connections to those facts forming a star-like shape. Every new raw source ingested to the warehouse will be either added to a current fact or dimension table or invoke creating new ones. This paradigm makes the warehouse more interpretable which facilitates working on new and more complicated reporting needs.
Analytics Engineers made database views called Data Marts that do fact and dimension table joins and filtering conditions internally so that only relevant data is exposed to the business users. This solves the complexity problem but still doesn’t address performance issues because views re-execute the join queries every time they are called.
Driving Personalization at Scale
Read our whitepaper to learn how you can hyper-personalize your customer experiences on top of your data warehouse.

Wide Tables or One Big Table (OBT)
Is Kimball’s model still valid?
Going back to Dave's talk from Coalesce 2020, he motivated the idea of ditching the star schema and just building denormalized big tables instead, that is, join all joinable fields to create a large multi-purpose table and making views over this table to be the data marts exposed to the end-users.
To follow with our examples, this just means getting all columns from different dimensions like users, order_details, items and addresses tables and adding them as columns to the Mixpanel events table. This will form a very wide table with many columns that will allow doing all kinds of reporting from one source.
Dave supported his proposal by the fact that cloud data warehouses are different now. Storage, for instance, does not cost as much as it did back when Kimball wrote his book which was one of the motives behind the Star Schema. This is because columns in several tables are not repeated which saves space and money.
Data storage is now very cheap and data compression techniques are better. He also mentioned that these tables will perform better than a star schema which was confirmed by a study from Fivetran. The conclusion of this study was that wide tables are 25-50% faster in Redshift, Snowflake and BigQuery than Star Schema and joins. Dave also claims that wide tables are more understandable for business people who “do not really understand joins”.
The OBT/Wide tables are strongly influenced by a strong operational layer and while Dave did not have much time to define what it looks like, it definitely relies on the staging layer mentioned earlier and on other intermediate tables.
What does the community think about Wide Tables?
After the session, the dedicated slack channel for discussions was on fire. Many people supported the idea, others presented counter-arguments, and the rest were still processing the content from the session.
To get the best of both worlds, we can still utilize Kimball’s Star Schema as an intermediate step after the staging layer, then materialize Wide Tables out of it. Kimball is great for creating a single source of truth especially when business entities need to be built from lots of different sources, and when business logic around metrics and attributes does not directly follow the schemas in data sources.
Doing this will allow business rules to be defined in a unified way in the Star Schema which facilitates the jobs of data professionals, then utilizing these definitions when denormalizing facts and dimensions into wide flat tables to be the layer exposed to business people.
Power users can now access the Star schema directly to gain insight or conduct ad-hoc analysis, and business users will run their heavy queries on the fast wide tables to generate reports. Materializing both will come at the cost of increased storage fees which is currently not very expensive. Another hidden cost to this paradigm is increased warehouse build-time but I believe the benefits of this outweigh the downsides in most cases.
However, implementing this combined architecture is not recommended for those just starting out and that wide tables materialized directly from the staging layer is an easy and direct way to start reaping the fruits of a newly constructed data project.
Conclusion
The topic of warehouse modeling is a very deep one and lots of great engineers do not make bold statements about it for this reason. There is no one-size-fits-all model, it largely depends on business needs, data complexity and tools used. Opinions of people are shaped by their experiences and many counter-arguments in the mentioned discussions had specific cloud warehouse tools in mind. For example, how much better BigQuery is with wide tables or BI tools like Looker perform really well with Star Schemas.
Personally, I am against making too many decisions based solely on the tools currently used because it will make future migrations to that cool new tool harder, but maybe you are already using that cool tool and vendors will not change the pricing or the user experience to an extent that will make you want to migrate.
Practical Advice
If you are just starting and figuring out business needs on the way, I recommend not trying to architect the warehouse early unless your data is too large -- doing a staging layer and wide tables should get you from scratch to insights in little time.
When things start getting more complex, it is worth investing time digging more into Inmon, Kimball, Data Vault, Wide tables and new designs coming out every day like Unified Star Schema, as well as other models that we may get deeper into in future articles.
Digging deeper into warehouse architectures may not be the best practice for someone just starting out because whatever model you choose will need to be adapted and changed multiple times as you get exposed to more problems. You can incrementally build and research more complex and useful warehouse architectures (like the combination between Kimball and Wide tables mentioned before) after achieving stability.
Driving Personalization at Scale
Read our whitepaper to learn:
- How PetSmart delivers personalized messages
- How IntelyCare increased controlled experiments by 700%
- How Warner Music Group manages fans, artists, and labels