We’ve moved from the era of Big Data to the era of Big Complexity. With data now centralized in data warehouses, the real complexity is from the number of systems that interact with data, not the volume. And with that, the status and health of your customer data workflows are crucial. A disruption in your customer data platform can lead to inconsistent customer experiences, missed personalization opportunities, and lost revenue.
So how do you address broken pipelines? While you can’t always prevent them, you can at least be alerted about them so that you can fix them quickly. Defining what alerting should look like across your entire data stack is challenging, but it’s important because it enables you to proactively address issues as soon as they arise. In a perfect world, you want to have a consistent flow from data acquisition, data ingestion, to data activation.
For years, software developers have been leveraging alerting to improve application performance and reduce downtime. Alerting tools, like Datadog, solve this problem by providing a single platform where you can proactively view all of your infrastructure metrics across cloud providers — measuring and tracking factors like runtime, application performance, databases, and servers.
Why You Need Alerting
Much like how your production code and infrastructure run your applications and websites, your data stack powers your day-to-day business operations:
- Ingesting real-time insights into a dashboard for your leadership team
- Processing and transforming raw data into usable analytics
- Activating newly qualified leads in Salesforce to power timely outreach
- Creating custom audiences for ad retargeting and marketing campaigns
- Enriching your product analytics platform (ex: Amplitude) with additional contextual customer data
For all of these scenarios, you’ll need robust alerting in place to identify points of failure because your customer data activations are as critical as your core marketing operations.
The Worst Type of Alerting
There’s nothing worse than sitting down to start your workday and seeing ten missed messages in Slack from one of your internal stakeholders who is notifying you that Salesforce has not received the latest product-qualified leads. This type of alerting is not only stress-inducing, but it’s also inefficient. When this happens you immediately have to drop everything you were doing to identify the problem. Usually, this means reviewing your audience or campaign activation to understand where and how it failed. There could be many reasons, but in many cases, failures tend to be linked to upstream or downstream changes. The problem could also be related to the formatting of the data itself.
Too Many Alerts
One way to avoid the internal stakeholder alarm is by creating alerts across your entire data stack. However, over-indexing on alerts can lead to alert fatigue, causing your marketing teams and operational stakeholders alike to ignore. Firstly, when you have alerts set for everything you will inevitably begin ignoring certain alerts. It’s very similar to the “boy who cried wolf” story. Triaging and grouping alerts can prevent fatigue and help marketing teams stay focused on campaign performance rather than chasing down every notification.
Configurable Alerting
Alerts need to be configurable. You should have granular control over when, where, and how you get alerted. Every organization is going to be slightly different in what they consider to be a data incident, so it’s important to define this within the context of your organization.
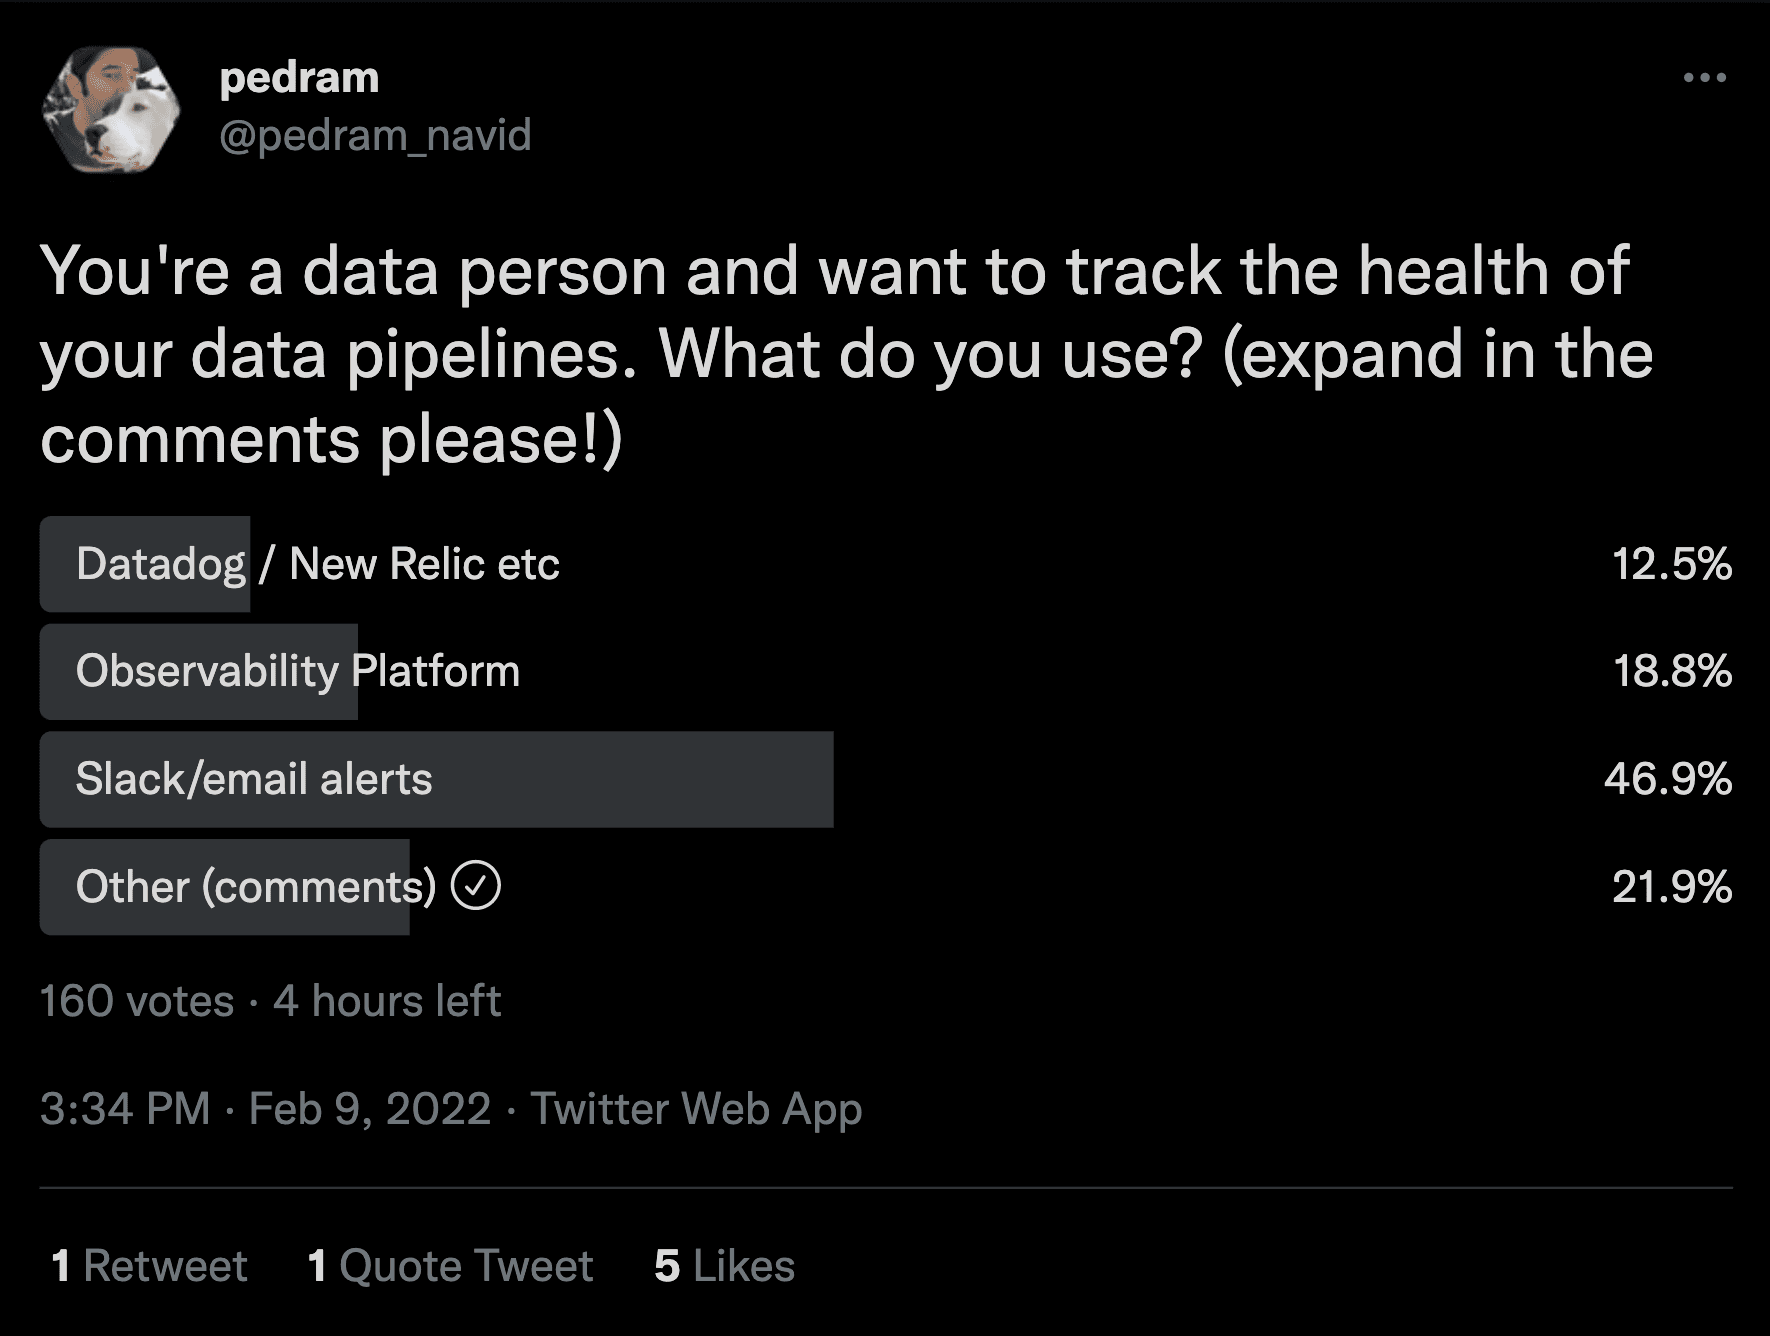
You should be able to choose how you receive your alerts too, as some channels are better suited than others for varying levels of severity. For example, having a dedicated Slack channel for high-priority emergency alerts guarantees that somebody on your team will see that problem and be able to proactively respond in a timely manner even if you can’t. Whereas email alerts could make sense for less severe bugs.
How We Handle Alerting at Hightouch
When it comes to setting alerts that matter for your business, there’s nothing more important than configurability. At Hightouch, we try to make alerting as seamless as possible within our platform so that you have full visibility into your data.
We let you define the exact number of row failures in your data sync to kick off an alert to your data team. You can also choose your alerting interval by grouping errors that happen within a certain timeframe (ex: grouping errors that happen within 15 minutes so that you only get one notification). On top of this, you can define row-level thresholds as a percentage of your total rows or synced rows. Best of all, you can select how you receive these alerts, whether it be in Slack, Email, Datadog, Pagerduty, etc.
Our New Datadog Integration
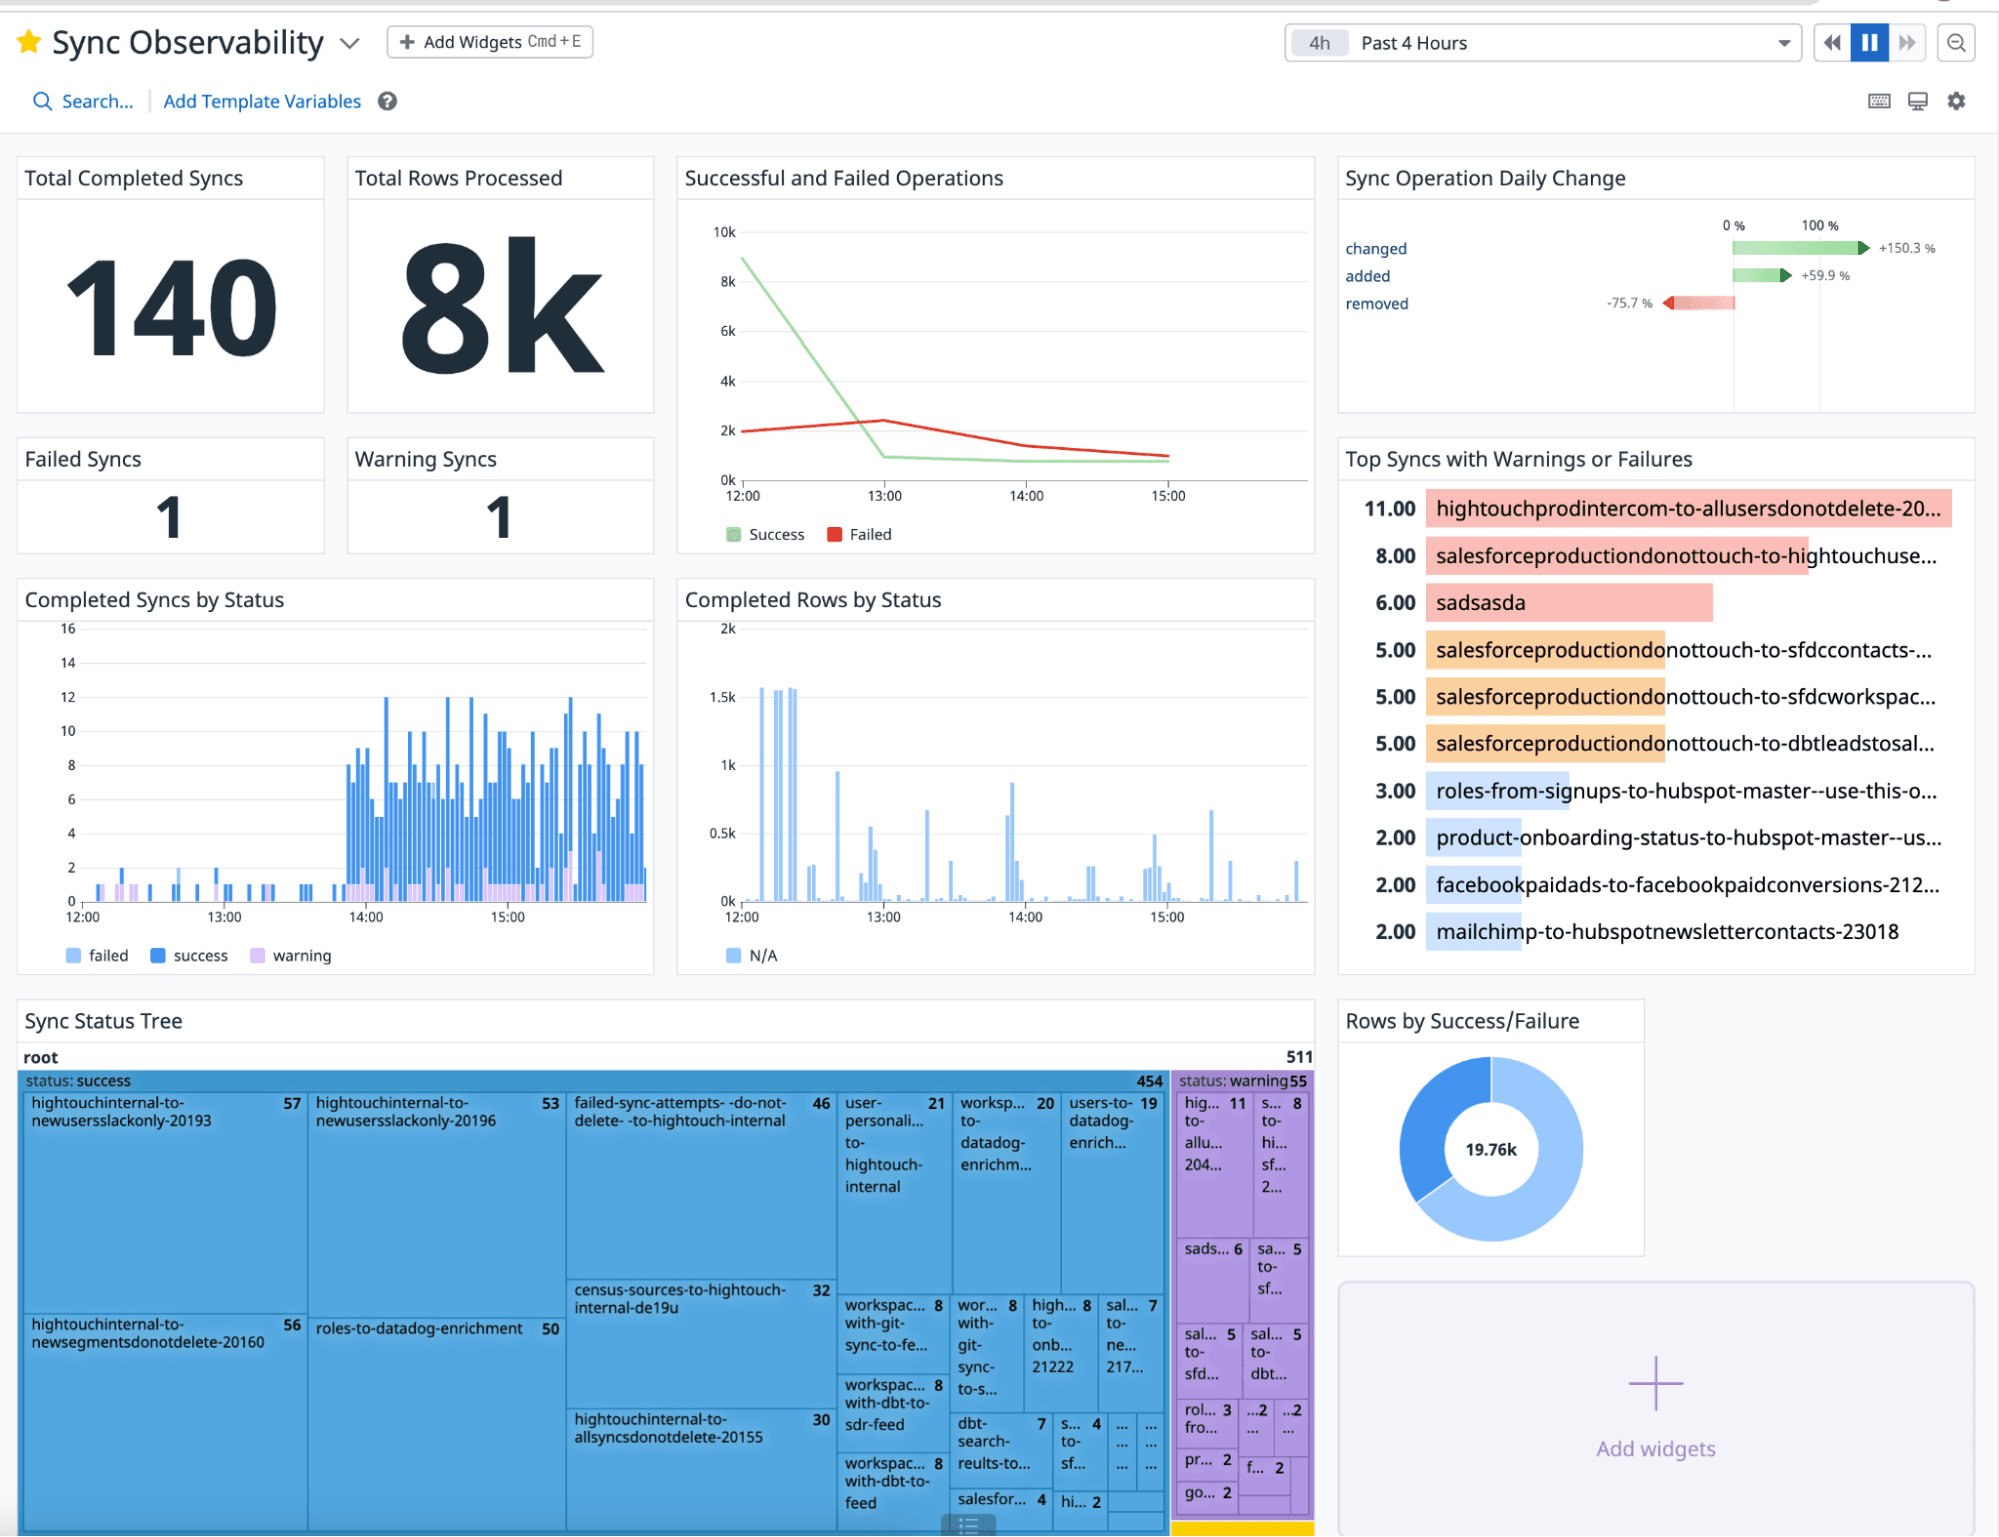
For example, here’s how we monitor our internal Hightouch syncs with Datadog. We have set up Datadog monitors on critical syncs to ensure they’re operating without any errors and are operating on an expected number of rows. If we see any spikes in warnings, we can drill down to the specific sync to isolate the trend. You can learn more about our new Datadog integration in our docs
The Future of Alerting: Beyond Reverse ETL
There are multiple aspects of your data stack that need alerting whether that be monitoring changes to your Snowflake tables, your data pipelines, your data models, or even your analytics dashboards.
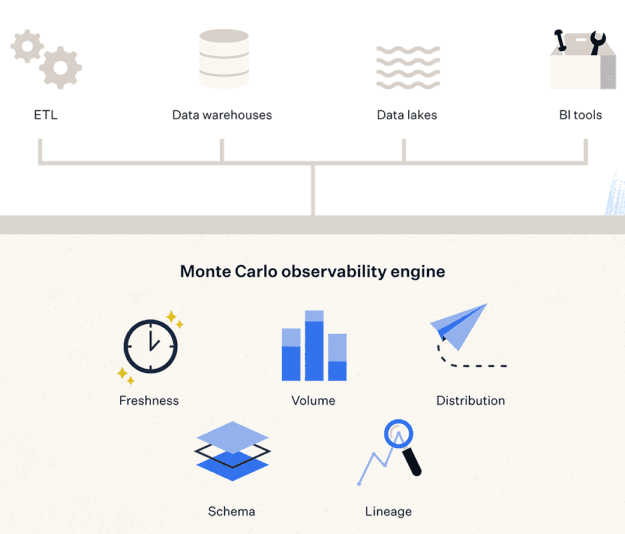
Trying to manage your alerts across all of your different solutions is difficult and this is the exact challenge that Monte Carlo Data solves: Monte Carlo is a data observability platform that helps you avoid data downtime. At its core, Monte Carlo uses machine learning to monitor your data warehouses, data lakes, ETL/ELT pipelines, and business intelligence tools. The platform helps you identify the root cause of data issues so that your teams can easily resolve problems faster and avoid data downtime.
Monte Carlo gives you access to everything from deleted tables, schema changes, rule breaches, anomalies, etc. The easiest way to understand Monte Carlo is to think of it as a layer that sits on top of your existing data stack monitoring metrics, logs, and traces all without ever storing your data.
One of the coolest factors about Monte Carlo is that it requires little to no configuration. As soon as you connect to the platform, it will automatically use ML models to learn your environment and understand your data.
Just like how Datadog provides real-time insights into your application performance and infrastructure, Monte Carlo provides real-time alerts and insights into your data. The future of alerting is using Datadog to monitor application performance and Monte Carlo to monitor data quality across your entire data stack. There’s nothing more valuable than having a holistic, end-to-end view of your data from when it first gets ingested into your warehouse to every step that happens afterward, and this is exactly the value that Monte Carlo provides.
Configurable Alerting for Better Data Observability
As data teams scale, the operational overhead of deploying tests to cover all scenarios becomes increasingly difficult. And as data ecosystems grow, the sheer magnitude of unknown unknowns (in other words, data issues that you can’t predict) has grown, causing analyst bottlenecks, time-intensive fire drills, and loss of data trust.
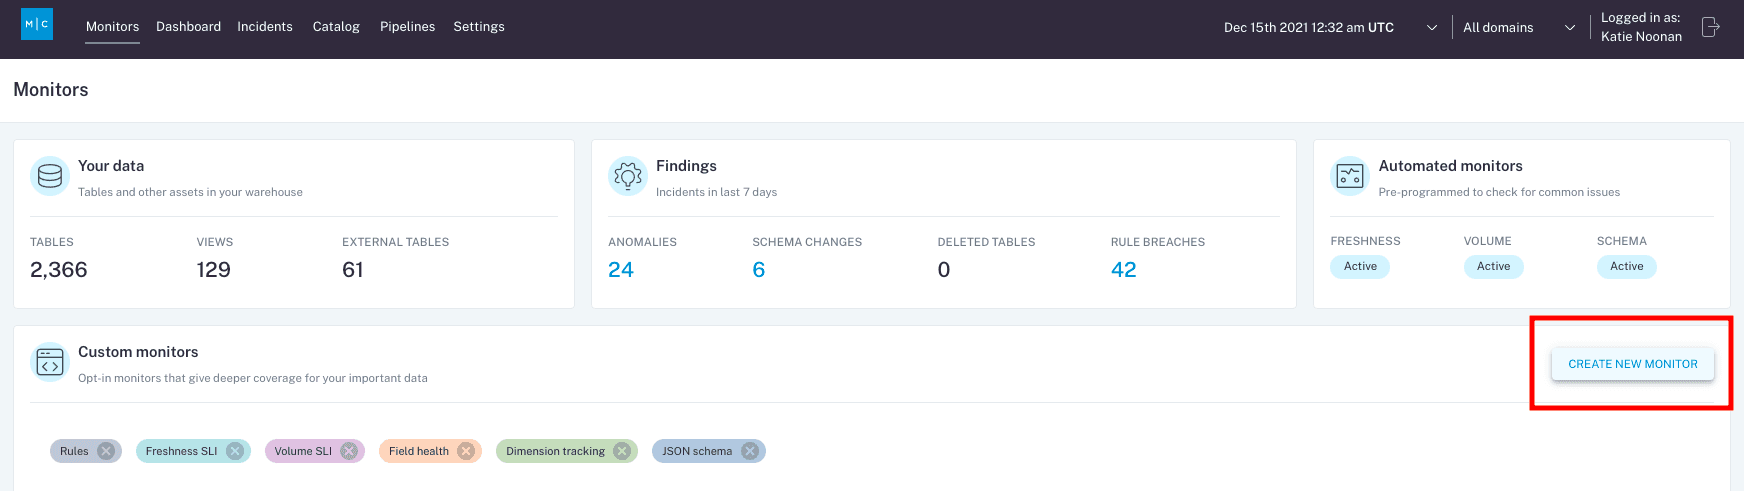
With Monte Carlo, data teams can deploy automatic monitors across every table in their data warehouse or data lake, and then monitor those tables for unexpected spikes or drops in freshness, volume, and unexpected changes to the schema.
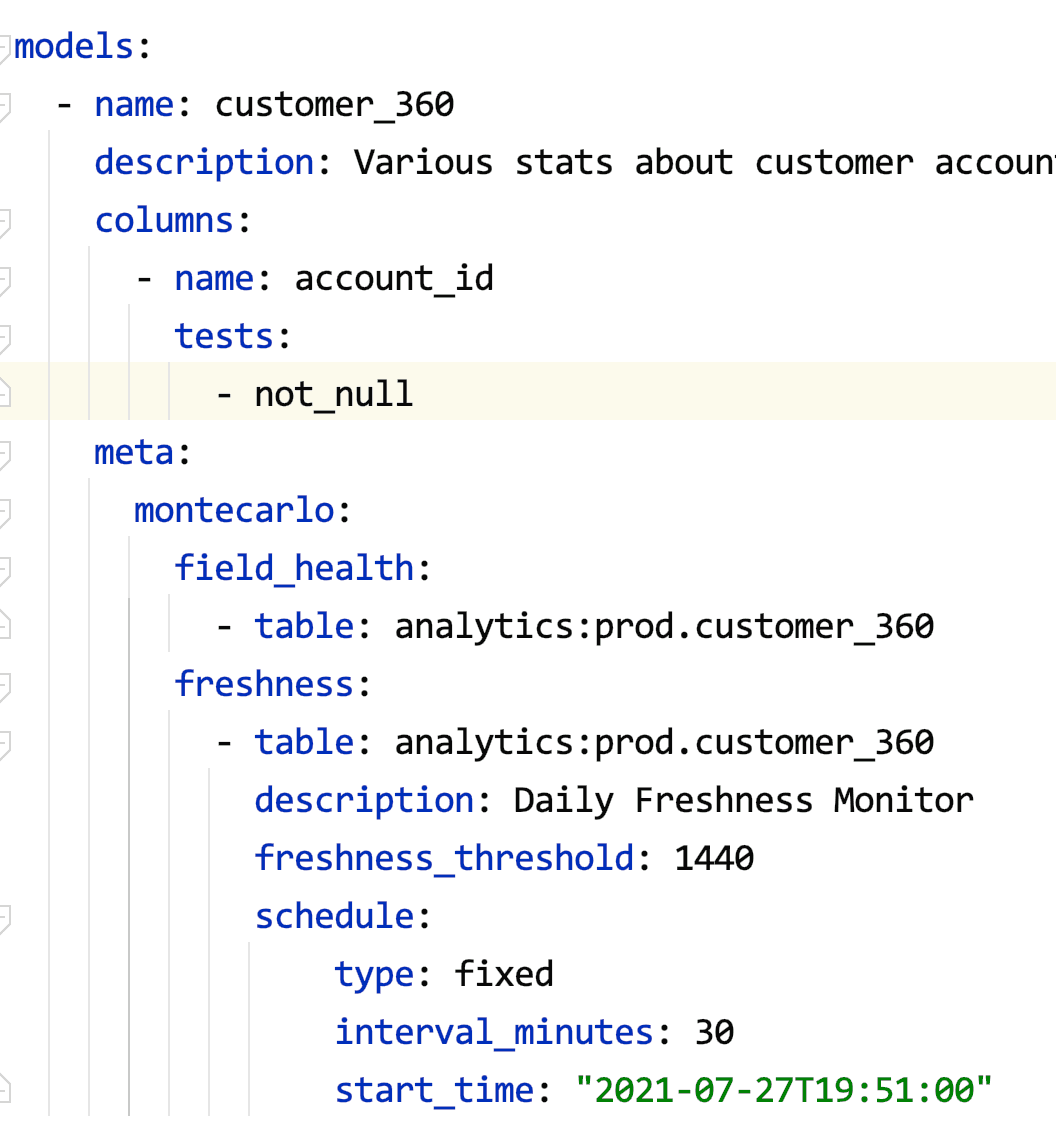
To supplement these automated monitors, Monte Carlo offers multiple custom monitors to identify and alert for specific anomalies within your underlying data – checking for anomalies such as null percentage, unique percentage within field values, and changes to the distribution of values. Monte Carlo also offers more in-depth customized monitors in the form of SQL commands that check for any condition that can be expressed in SQL. The platform gives you a central place to keep track of and create new SQL rule-based monitors, either in the UI itself or as a YAML config via monitors-as-code.
With this advanced feature, you can write custom SQL to check for anomalies specific to your business. Given the flexibility of SQL, Monte Carlo customers often use these rules to get notified when thresholds for null values, referential integrity, empty strings, etc. are breached. And now, with our Python SDK, it’s even easier to create custom alerts and weave them programmatically into your existing data engineering workflows with Hightouch and other tools.
Hightouch + Monte Carlo: Better Together
Hightouch and Monte Carlo are excited to announce their joint commitment to helping mutual customers accelerate the adoption of reliable data with observability and reverse ETL.
Interested in learning more about how our tools work together? Check out our other joint piece with Monte Carlo on Solving Data's "Last Mile" Problem with Reverse ETL and Data Observability.