Salesforce provides a ton of great analytics features around reporting and it’s relatively straightforward to visualize the base data that lives in your CRM and see exactly which sales reps are generating the most pipeline, or which emails are receiving the highest open rates.
However, basic Salesforce reporting is limited, and there’s no simple way to combine, aggregate, transform, and merge the data in your CRM to answer more complex questions or calculate core metrics about your customers. This is one of the key reasons that Salesforce acquired Tableau.
What Is Tableau CRM?
Tableau CRM is not a customer relationship management platform. Believe it or not, Tableau CRM is a completely separate tool from Tableau’s core product. Formerly referred to as Einstein Analytics, Tableau CRM is an analytics portfolio of products that is completely unique to the Salesforce ecosystem. Since Salesforce acquired Tableau, this product has been renamed yet again, and it’s now commonly referred to as CRM Analytics.
At its core, CRM Analytics is an enhanced, cloud-based visualization, and predictive analytics offering that integrates directly with your Salesforce instance (e.g., Sales Cloud, Marketing Cloud, Service Cloud, etc.) CRM Analytics gives you the ability to merge additional data sources with your Salesforce data and transform it to create a single dataset so you can perform AI-driven analytics and do predictive modeling.
How Does Tableau CRM Work?
There are four core product offerings within CRM Analytics: data integration, data preparation and transformation, BI (business intelligence), and embedded analytics.
Data Integration
The data integration feature of CRM Analytics is known as Salesforce Data Pipelines. This feature offers a limited number of different connectors to sources like applications, databases, and object stores so you can move data both in and out of Salesforce via input and output connectors.
In order to make use of Salesforce Data Pipelines, you first have to establish a connection to your source and store that information as a connected object in Salesforce so you can reference it later. You can actually leverage existing Salesforce objects as data sources if you’re solely looking to move or transform your local Salesforce data.
Data Preparation/Transformation
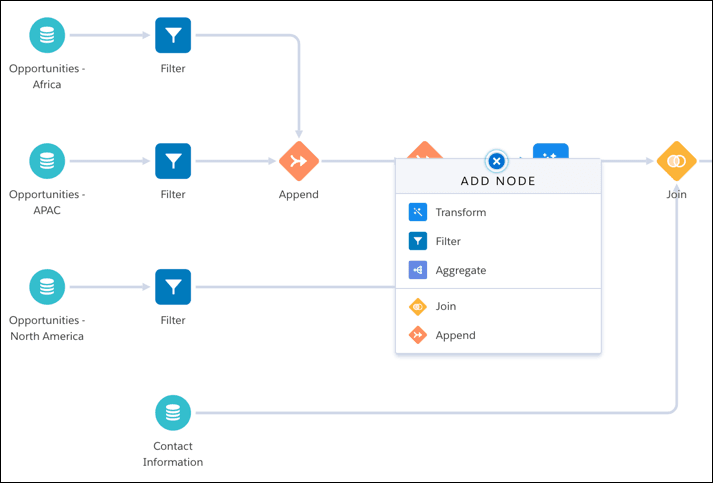
For data preparation and transformation, CRM Analytics has two interfaces known as Data Prep and Data Manager, which you can access in the Analytics Studio. Data Prep is a visual workflow builder where you can join, aggregate, and transform your local Salesforce data or data from external sources. You can build and save recipes to prepare and load data into a specified target (in most cases this is a dataset that lives in your Salesforce environment). Here’s an example from the Salesforce documentation.
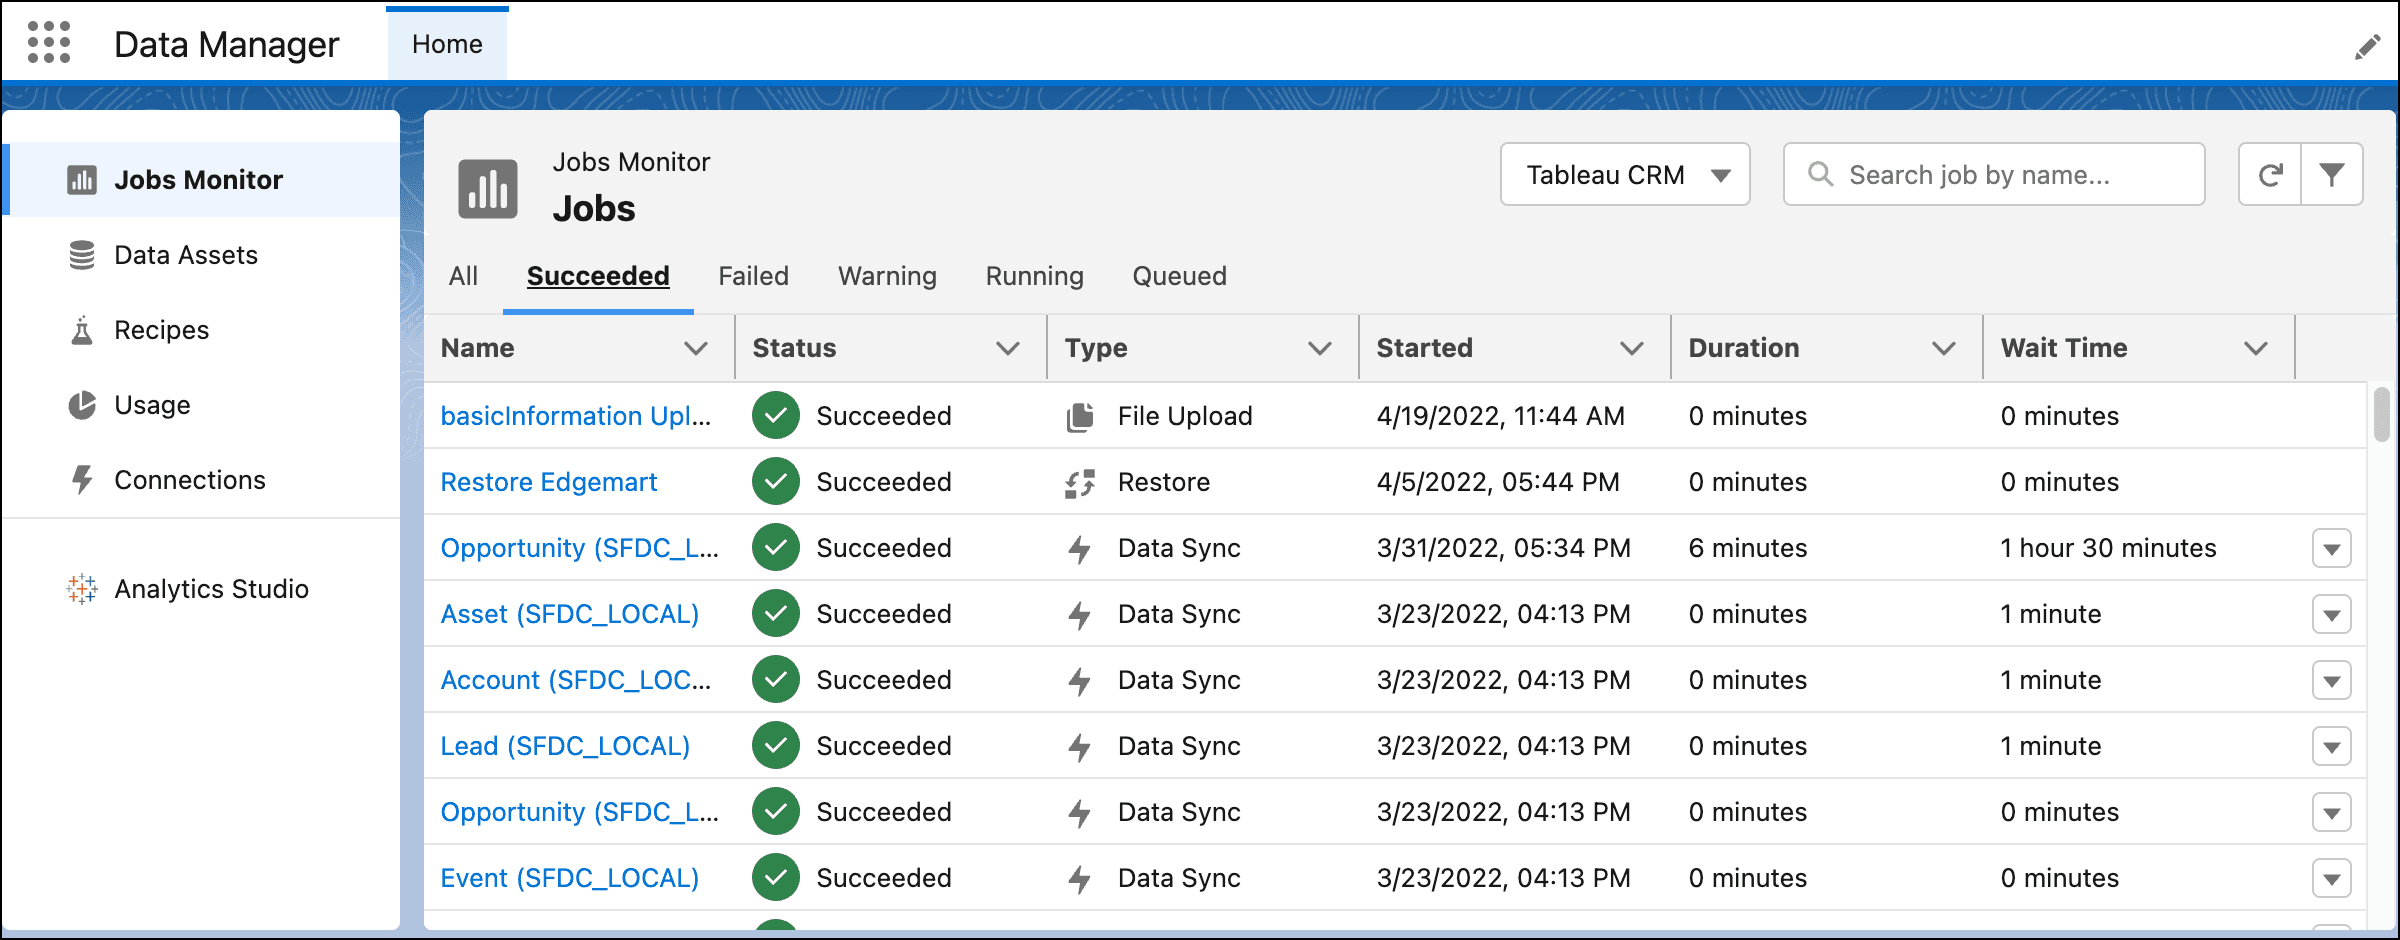
Data Manager is a visual interface that lets you schedule and monitor every pipeline and transformation job within your Salesforce environment. With Data Manager, you can see the progress of your recipe, data sync, other jobs, and even update objects and setup up additional connections to external data sources. Here’s an example from the Salesforce documentation.
BI (Business Intelligence)
After you’ve set up your pipelines and run your transformation jobs, you can organize your data into various assets or collections of datasets, lenses, dashboards, and custom apps for your end users to consume.
- Datasets include data that is stored in a denormalized form and optimized for interactive exploration.
- Lenses represent views into specific datasets and they’re quite similar to Salesforce reports.
- Dashboards use the data from datasets or lenses to create a curated set of tables, charts, and metrics for visualization.
- Apps function very similar to folders and they can store lenses, dashboards, and datasets in any combination.
These different collections make it really simple for you to share and grant access to your business teams so they make decisions that move the needle forward. However, if you don’t want to query your data directly in Salesforce, CRM Analytics also provides direct connections to CDPs (customer data platforms) and other data platforms like Snowflake and BigQuery so you can embed that data into your interactive dashboards without ever ingesting it into Salesforce through single sign-on.
Embedded Analytics
For embedded analytics, CRM Analytics provides Einstein Discovery. Einstein Discovery is a proprietary AI/ML offering that gives you the ability to proactively identify patterns and dependencies in your data. You can answer key questions about what, when, how, and why something happened so you can proactively make predictions, improvements, and compare differences.
Einstein Discovery lets you generate predictive, descriptive, and prescriptive insights. You can even explore relationships between your chosen input variables and your chosen outcome variables to generate AI-driven insights.
For example, you could calculate the likelihood of a deal closing by providing Einstein with both positive and negative attributes. Once you’ve provided this information Einstein can then analyze all of your current deals and calculate how likely it is for each of your opportunities to close. This same use case can be applied to basically any scenario that you define whether it’s numerical, binary, or even multiclass (e.g., multiple outcomes/results.)
Once you’ve built this predictive model Einstein will make recommendations on how you can achieve your goal and also point out possible red flags. You can also apply Einstein Discovery at the individual record level to make even more real-time predictions and recommendations.
How Is Tableau CRM Different from Salesforce Reporting?
Basic Salesforce reporting is relatively limited and you have no ability to transform or model your data in the way that makes the most sense to your business. You also can’t merge other data sources together and you definitely can’t build predictive models to inform your decision-making. CRM Analytics enables you to combine and consolidate data from multiple different sources so you can generate actionable insights across your entire organization.
Tableau CRM Pricing
CRM Analytics is actually surprisingly expensive and pricing starts at $75 per month for each individual user and can get as high as $150 per user if you want to unblock all of the features just described. The base version only comes equipped with Einstein.
Problems with Tableau CRM
The entire premise of CRM Analytics is to perform analytics jobs within your Salesforce instance and remove the need to ever go to another platform. CRM Analytics was created solely to compete against the major cloud providers. The problem is, your data team doesn’t live in Salesforce, and Salesforce is not an analytics tool or true single source of truth.
All of your data (including your Salesforce data) likely already lives in a data warehouse like Snowflake, BigQuery, or Databricks. After all, this is where your data engineers and analysts manipulate, transform, and model your data to define key metrics like ARR, LTV, MRR, churn rate, etc.
The main value of CRM Analytics is that it enables you to combine data from multiple sources and calculate your core metrics within Salesforce. There’s no such thing as an “everything” platform though. Salesforce is a fantastic CRM (we use it internally), but it's not an analytics platform designed to store, manipulate, and query structured and unstructured data. Warehouses provide faster query speeds because they're built for this exact use case and this is not even taking into account the cost optimization.
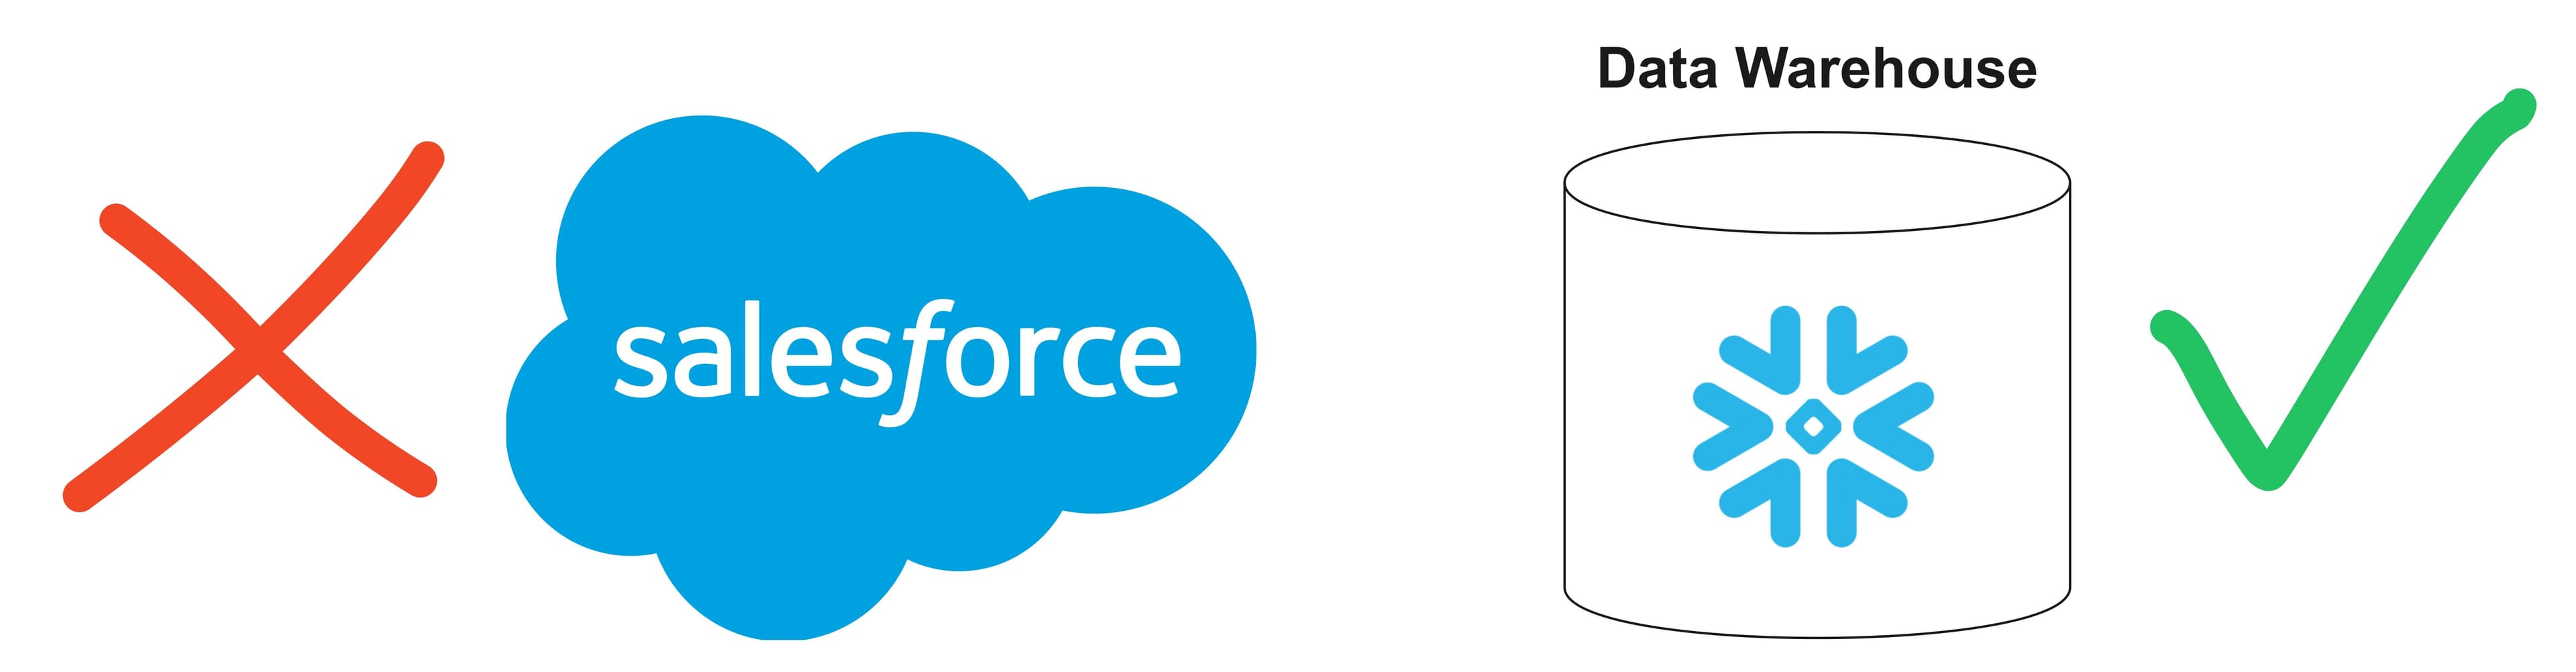
The question you have to ask yourself is: Should Salesforce be your source of truth? If you’re a data-driven organization the answer is absolutely no!
With Salesforce you can’t take advantage of SQL or any other development language for that matter. You also can’t use transformation/modeling tools like dbt or modern development practices via Git. You can do everything that CRM Analytics offers and more in your data warehouse faster, more efficiently, and more accurately.
If you want to enrich your Salesforce instance with other data sources, ultimately, you just need a way to sync the data models you defined in your warehouse to fields in Salesforce, rather than building and storing your models in Salesforce.
Alternatives to Tableau CRM
Reverse ETL is the easiest way to sync data from your warehouse to any downstream SaaS application (e.g., Salesforce). Reverse ETL tools like Hightouch run on top of your warehouse and query against it.
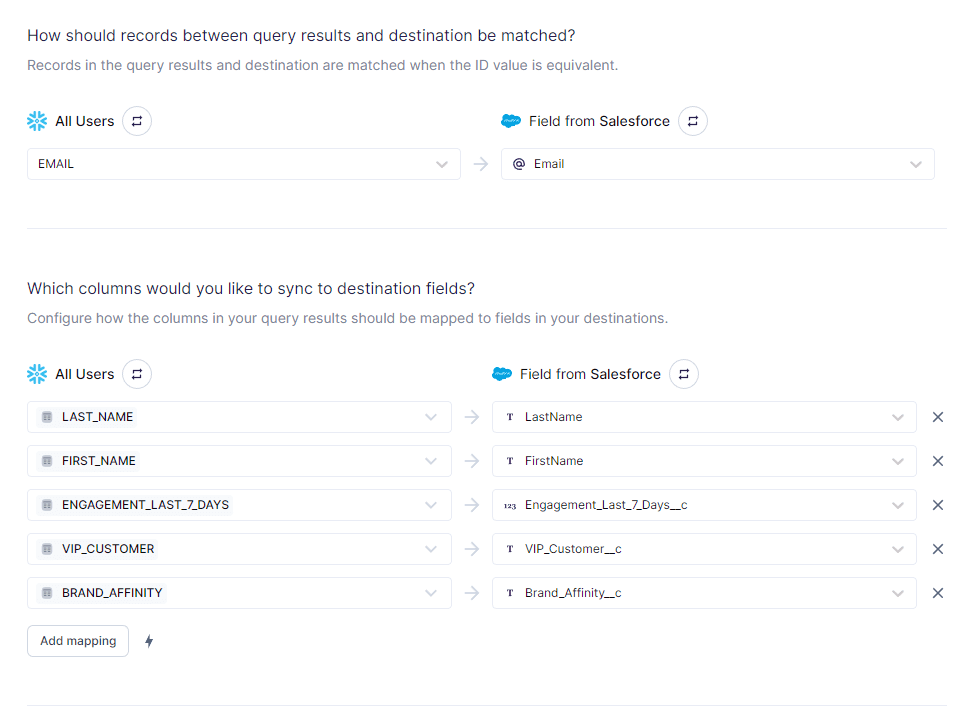
With Hightouch you can leverage all of your existing data models, or write simple SQL. All you have to do is connect to your source and your destination.
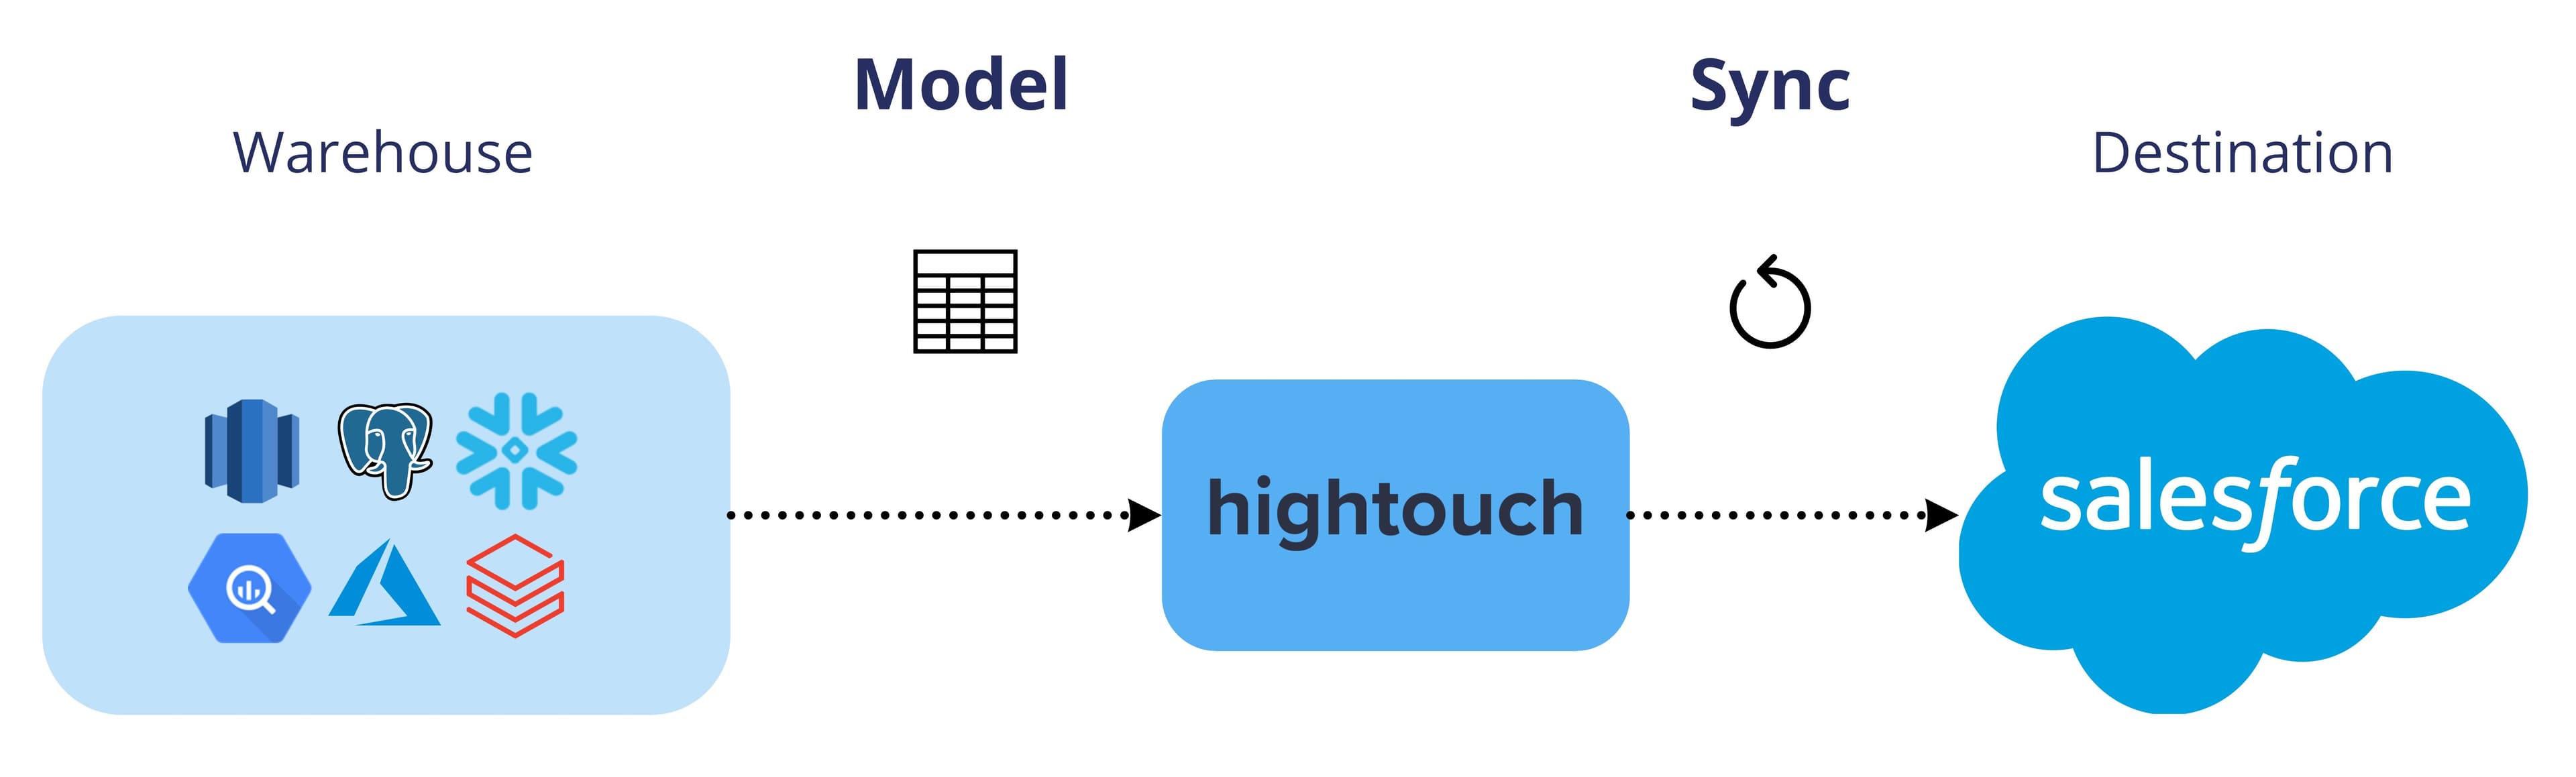
From there, you map the columns in your model to the appropriate fields in your destination and schedule, when, how, and where you want your syncs to run.
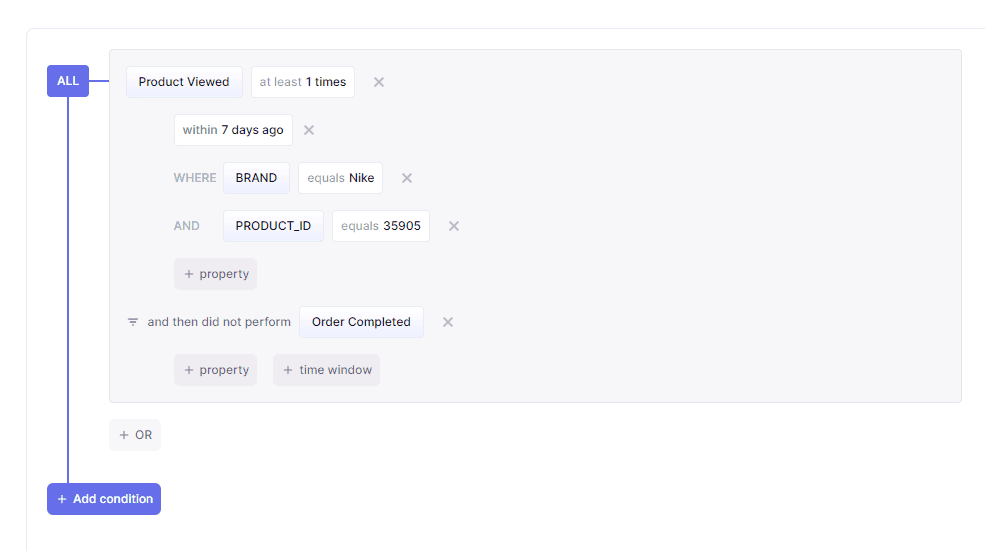
There’s even a visual audience builder for your non-technical users (e.g., marketing teams and sales teams), giving you the ability to segment audiences using the parameters your data team has set in place.
With Reverse ETL, all of your core business logic is defined and stored in your warehouse. There’s no reason to create a separate source of truth in Salesforce. Create a free Hightouch workspace today and start syncing your data to Salesforce.