We all know that the data warehouse is the epicenter of the modern data stack. Hightouch enables companies to make the most of what's in the warehouse–using the data not just for analytics but also to activate business operations with the latest enriched information.
Since the warehouse magnifies the power of what teams can do with their data, it also magnifies the risks. With the warehouse as the single source of truth, it can also become a single point of failure.
Observability at the warehouse level can significantly reduce the risks of warehouse-generated errors unintentionally going into production. Here at Hightouch, we've partnered with a company whose tool does just that: Datafold.
In this post, we'll walk you through how Datafold identifies and alerts your data teams about potential problems before your data goes into production–to dramatically reduce the risks of inaccurate or incomplete data making it into your Hightouch syncs. With Datafold's integration into Hightouch, data engineers and analytics engineers can fix bugs before they lead to lost time, revenue, or trust for downstream business teams.
How Datafold Works
Let's walk through an illustrative example for a company called Generic Beer.
Generic Beer had an initial table written in a dbt model, which categorized its beers into one of two bitterness levels: "malty" or "hoppy" (the unit is IBU, "International Bitterness Unit"; yes, that's a real thing).
Generic Beer has added some new beer styles to their product line, and they want to refine their bitterness score, adding three unique levels. The table change looks like this. ⬇️
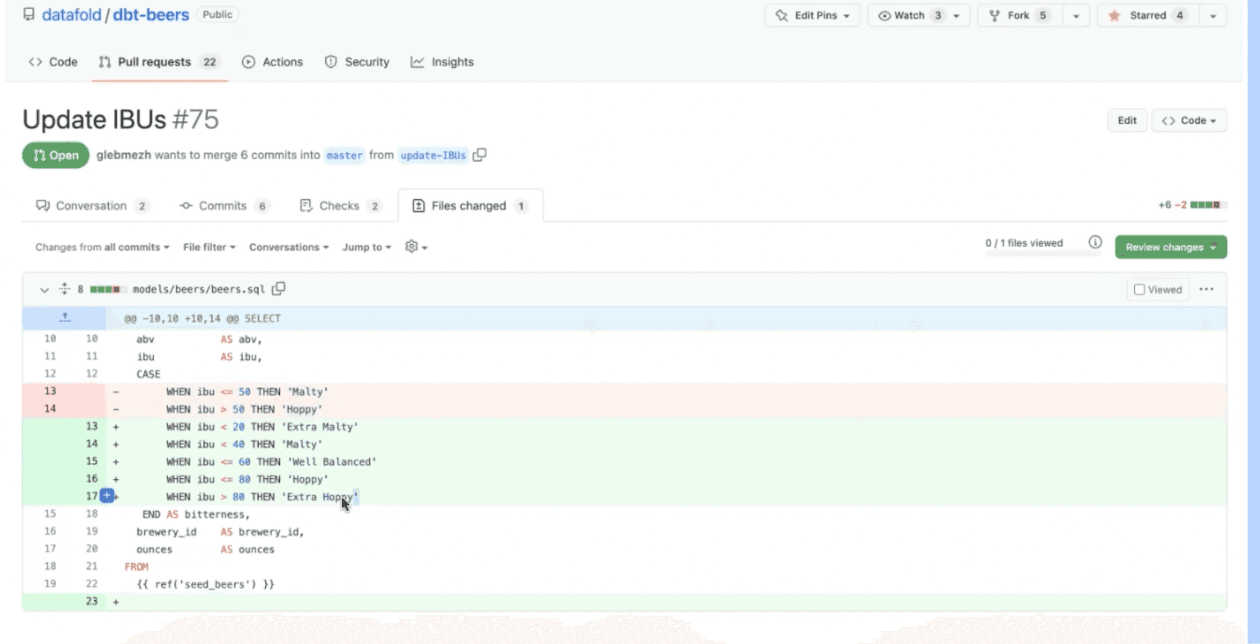
Modified SQL
This is relatively straightforward SQL, and the engineer writing this code should feel reasonably confident this change won't have any unintended consequences on the table itself.
For every change to a table, Datafold publishes a "Data Diff" in Github showcasing how the table itself changed. Here's the Data Diff for the update to the beer bitterness table. ⬇️
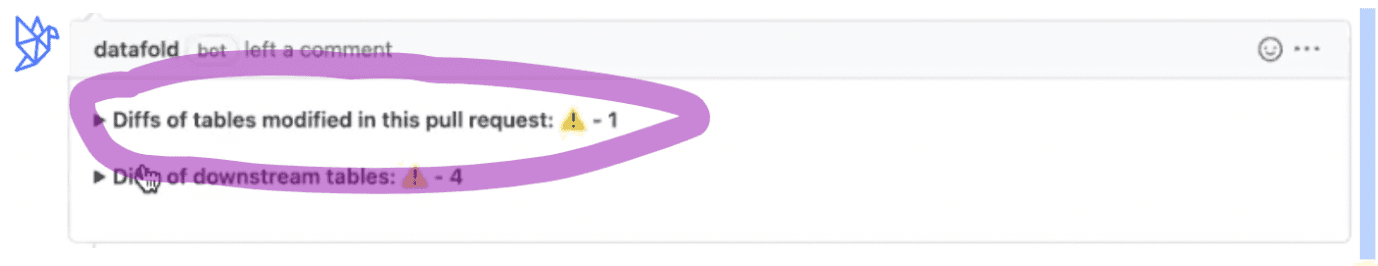
Data Diff Showing Changes to Table
There's a warning sign of "-1," but the report can be expanded to show more details.
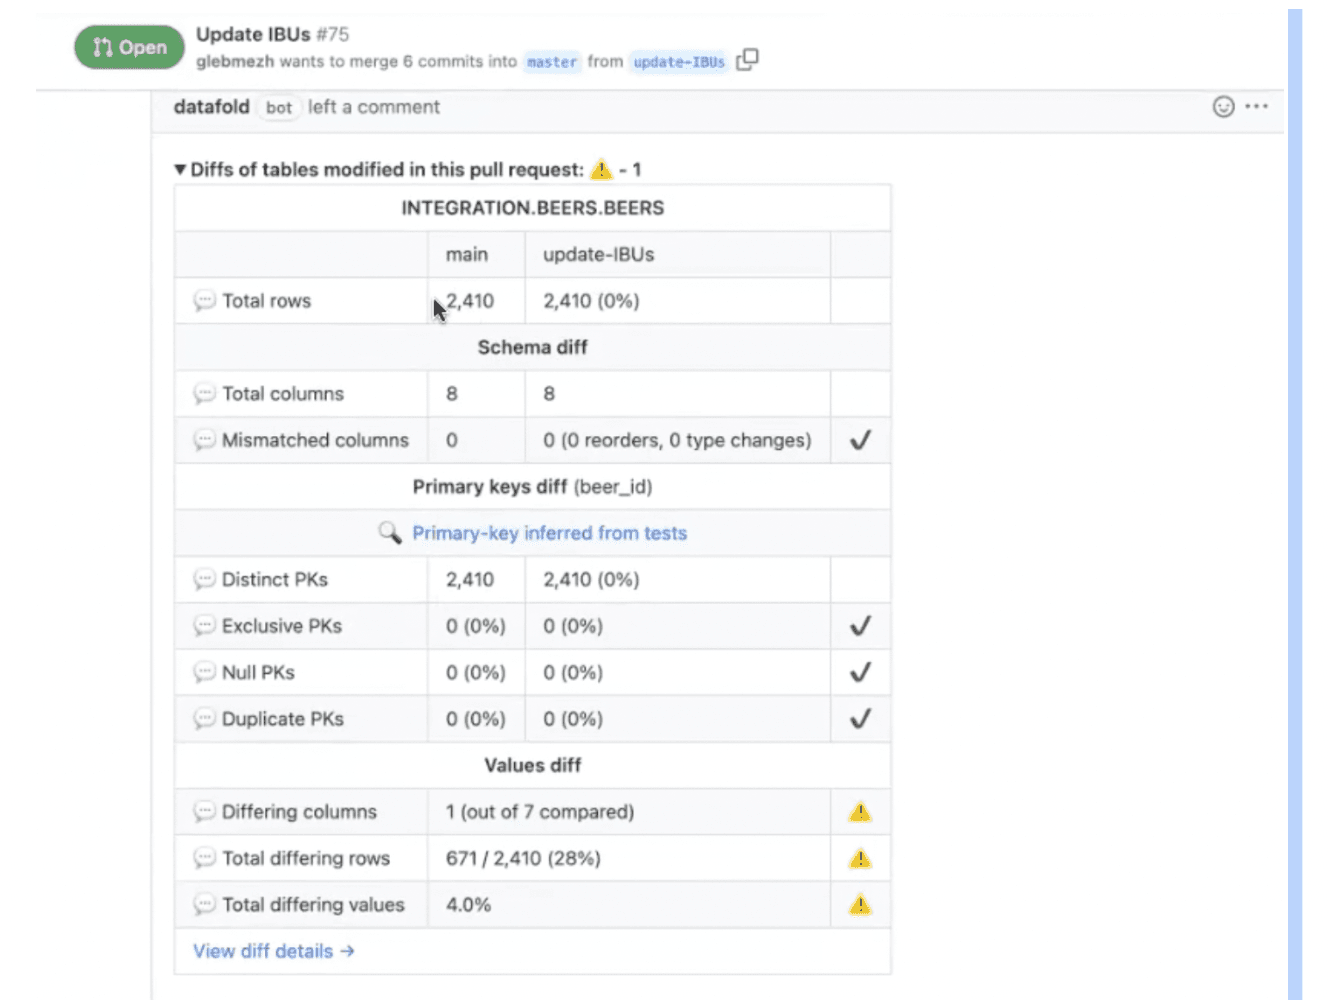
Report on Change Table
The full report shows that the essential elements of the table didn't change: there's the same number of rows, columns, and distinct primary keys as before. At the bottom of the report, the warning sign alerts us to what did change. In this case, it's exactly what we expected (changes to only one column affected 28% of rows).
In this scenario, everything seems correct in a case like this, so there's likely no reason to dig deeper. However, if you still want to verify the accuracy of your changes, you can verify the changes to a column by looking at the original values and updated values side-by-side. ⬇️
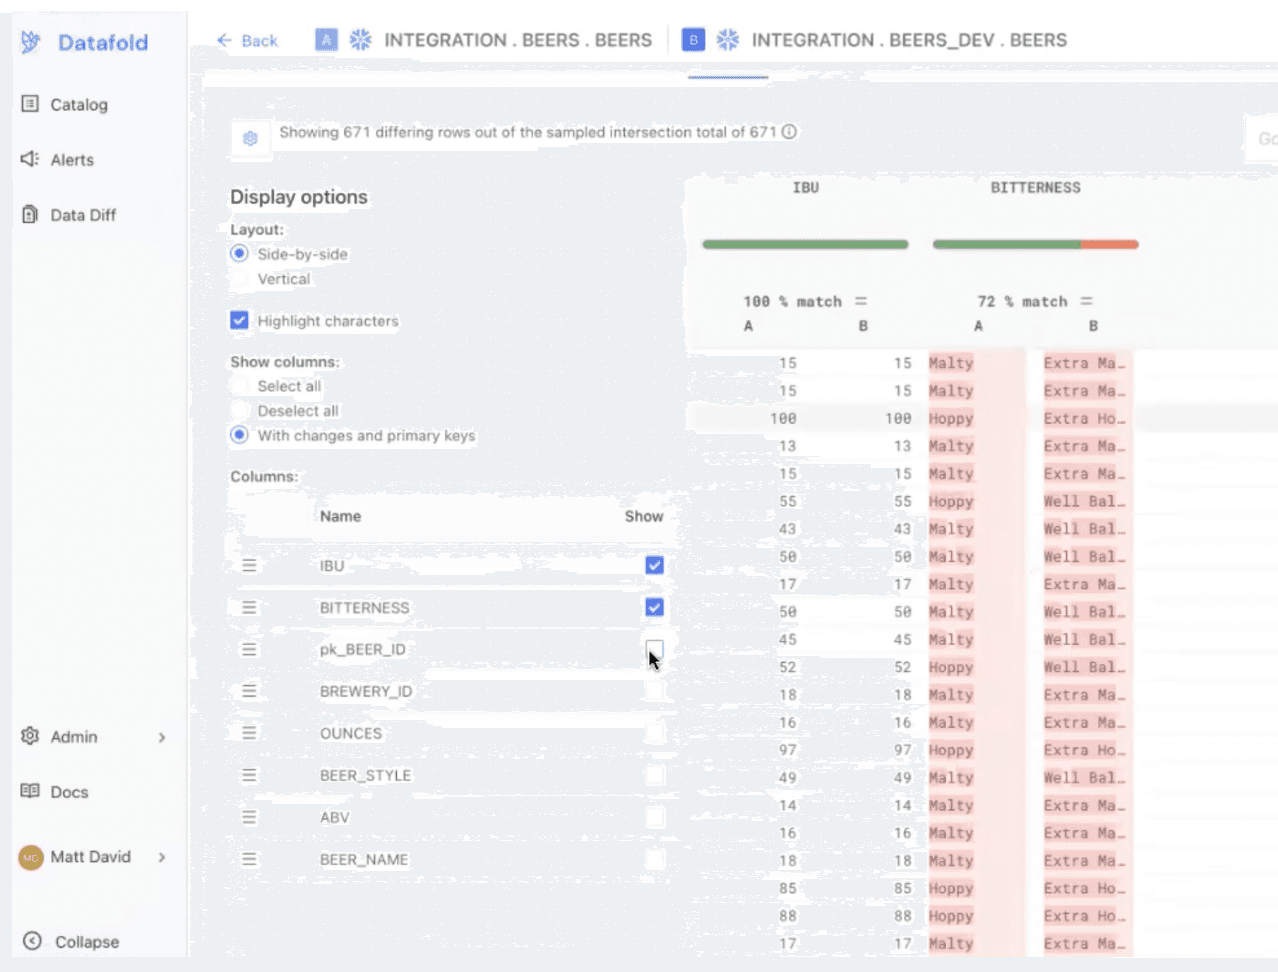
Column Before/After Modifications
You can also see the changes with a visualization showing the distribution of the values before and after you changed the data. ⬇️
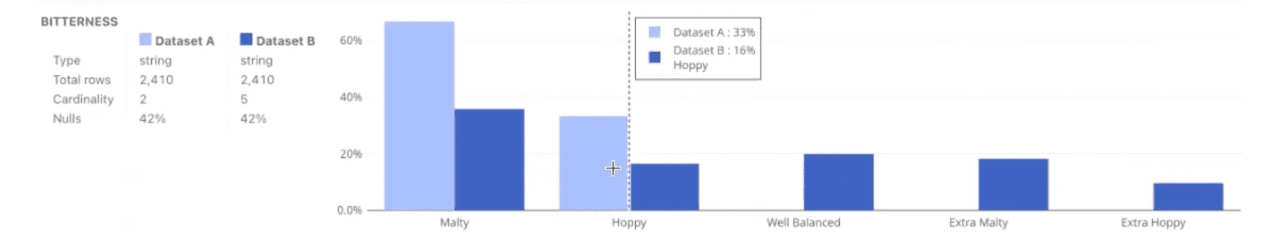
Modified Data
Without Datafold, this type of verification can be a tedious process that often involves querying your staging and production data and bringing that information into a spreadsheet.
Column-Level Lineage in Datafold
So far, we've looked only at table-level changes. Datafold's Data Diff also includes column-level lineage to monitor how upstream modifications to a column can affect that column downstream.
Sticking with the beer data, we can see that the change to the table impacted four downstream tables where that column appears. ⬇️
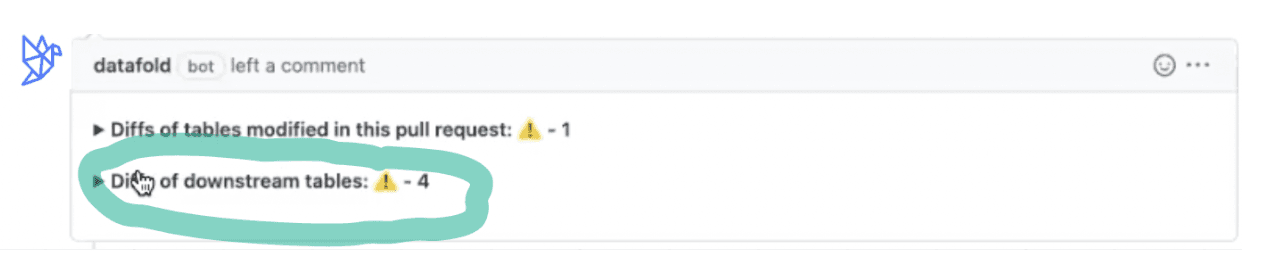
Pull Request
The Data Diff gives us full details on those four tables. In three of the tables, there are no surprises, but in one table, "PROMO_DELIVERIES," we see a drop in the number of rows. That's rarely a good thing. And this is a pretty significant drop (150 rows have disappeared). ⬇️
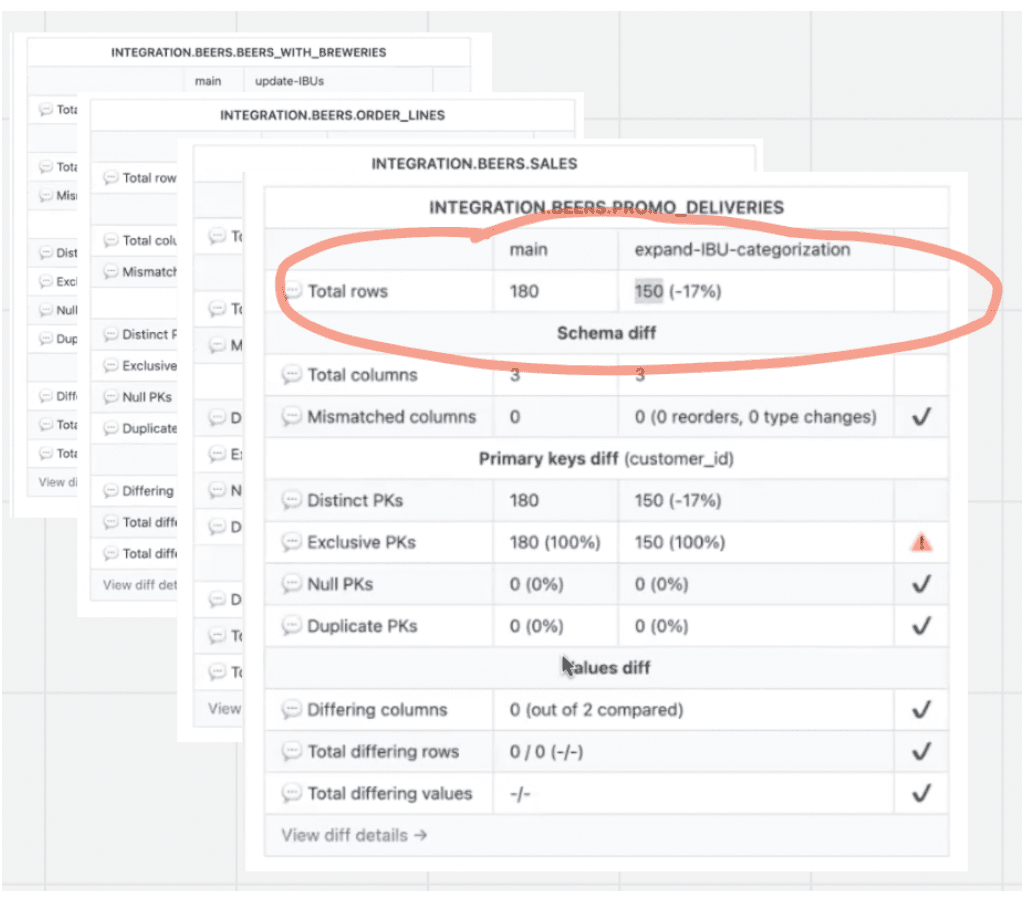
Reports on Downstream Changes to Columns
Datafold makes it easy to investigate what's going on. Just click on the table and navigate to the SQL query, and the issue is immediately apparent: the CASE WHEN statements for the PROMO_DELIVERIES table are hard-coded in the two original categories, and the table can't account for the three new categories we added. ⬇️
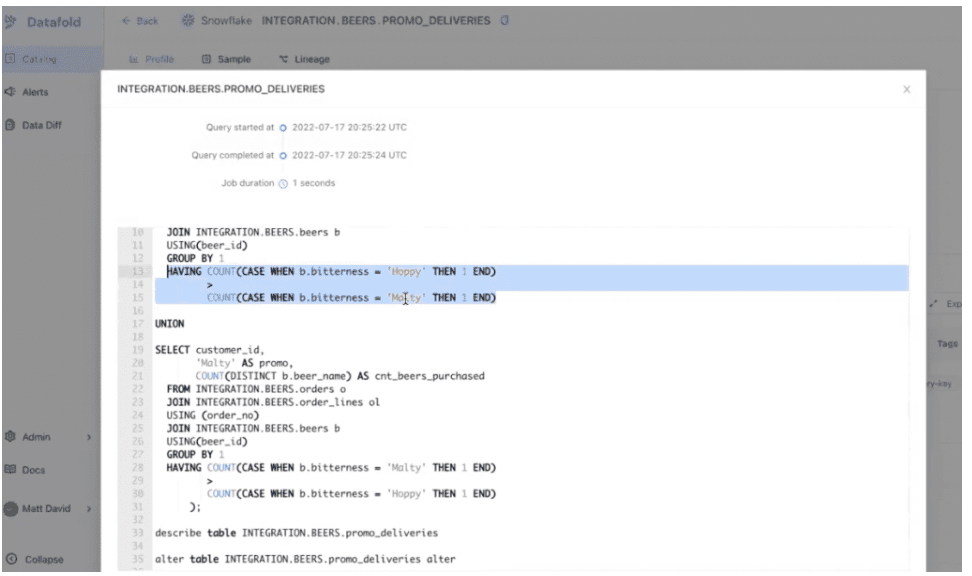
Hard-Coded SQL Statement
Even the most experienced data engineer or analytics engineer can't predict the possible downstream consequences of making a change like this. Datafold makes it easy to proactively catch these errors and prevent them from cascading into production.
You're probably wondering: "If dbt has built-in testing, wouldn't it be better to leverage dbt's testing capabilities rather than bring in an entirely different tool?" The reality is that dbt ships generic tests that are useful but limited to basic assertion and unit testing. As your environment grows, it's just not practical to add custom tests everywhere; to do so would involve not only maintaining and updating them but also anticipating every possible unintended downstream consequence.
Datafold + Hightouch
Datafold's column-level lineage tracking is fantastic for helping engineers find and fix bugs before they break things in production. The platform gets even more powerful when we bring Hightouch into the mix. Thanks to the new integration with Hightouch, Datafold customers can also get a Data Diff that examines their Hightouch syncs. ⬇️
Column Lineage
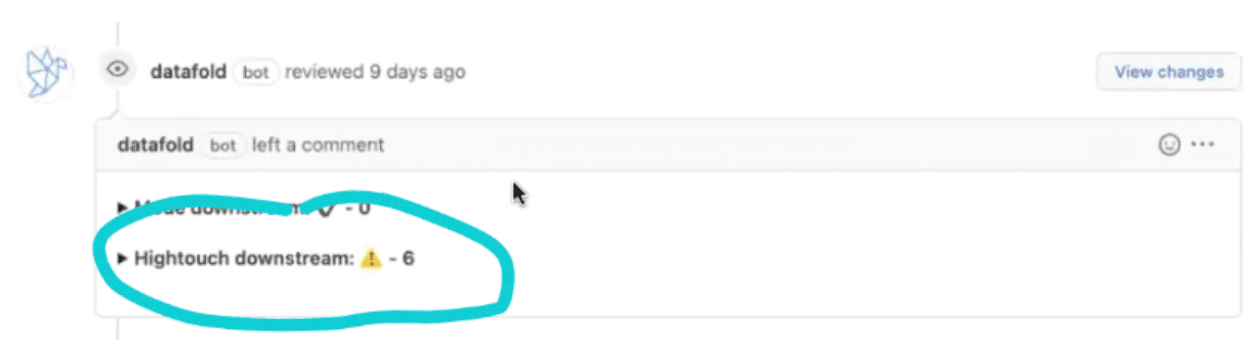
Of course, you expand and get further information about the affected models and syncs. ⬇️
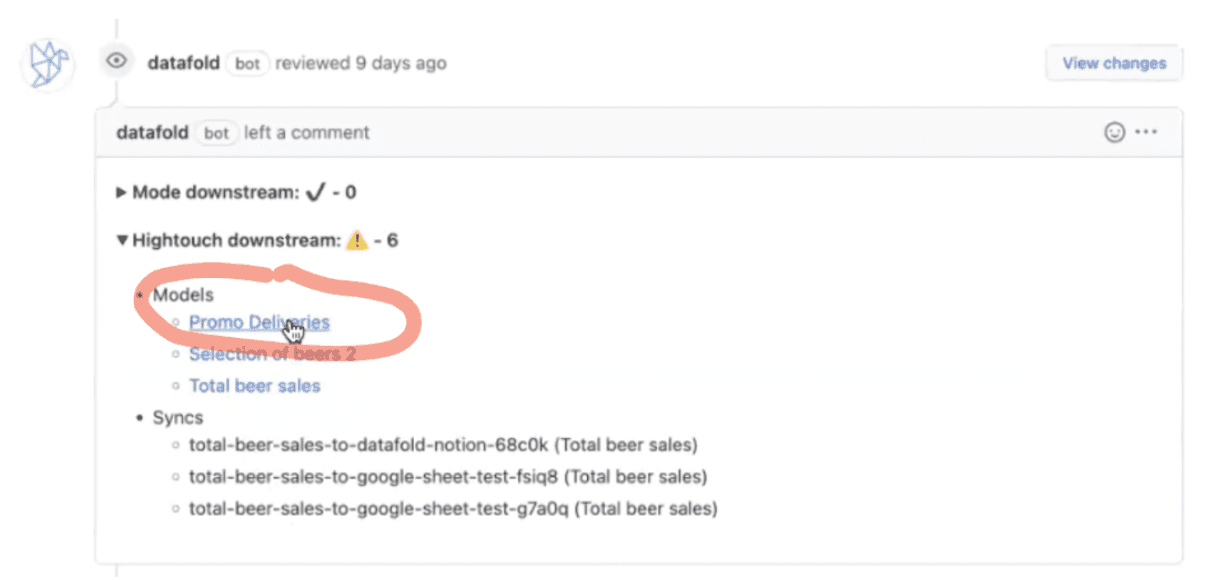
Data Diff Reporting on Hightouch Syncs
And finally, you can get visibility at the column-level–looking at any field and seeing how it may have impacted the Hightouch model. ⬇️
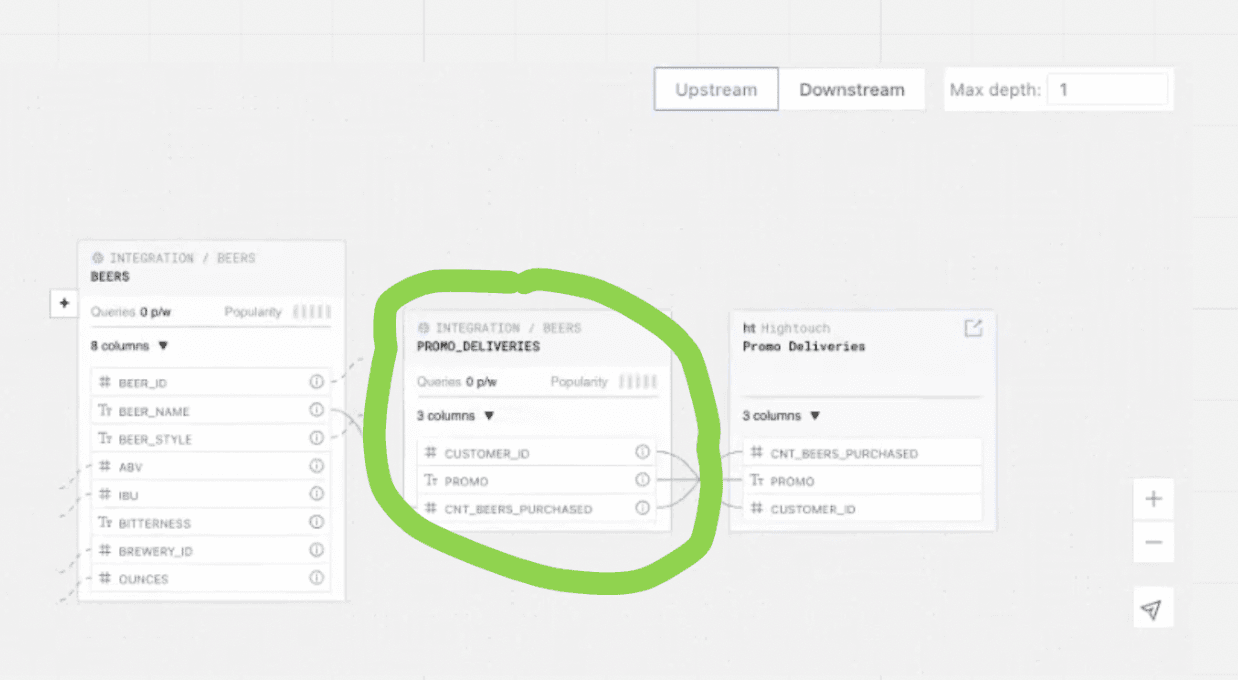
Report on Hightouch Sync
The unintended consequences we saw on the PROMO_DELIVERIES table have impacted the "Promo Deliveries" Hightouch sync. Assuming this is data about a marketing promotion, 150 missing rows would likely have a real-world impact–translating to, for example, Generic Beer's marketing team not having the names of 150 customers to whom it should be sending personalized emails.
Using the Warehouse to Power Data Activation
Companies using Reverse ETL to activate their data in their marketing tools and other business platforms are getting immediate value from their data. That's powerful, but it also raises the bar for data teams to produce accurate data.
Working in tandem with a tool like Datafold essentially adds guardrails to Hightouch, assuring you that your syncs are accurate and reliable so you have complete confidence in the business decisions that data drives.
Datafold's Director of Growth Matt David says their research shows that about 30% of all pull requests result in some type of bug.
Now, not all those are big, and not all will impact Hightouch syncs. But some portion of the bugs is likely to affect them. And since data synced by Hightouch is often customer-facing and used with immediate impact, you want to reduce potential issues to as close to zero as possible.
If you're interested in seeing how Data Activation can bring you business results you can sign up for a free Hightouch account today or talk directly with one of our data experts! If you'd like to add Datafold's powerful observability to your stack, reach out to them here.