Imagine this scenario. You’ve created a dashboard for an executive to help with business outcomes, something important they frequently use, like a customer retention or a monthly recurring revenue dashboard.
You’ve had no issue with the dashboard, then suddenly, you get an email from your executive saying, “What happened to the dashboard? All of the metrics are wrong. What happened to the data?”
It turns out, after some digging, a change in your data infrastructure impacted a field in your data warehouse–thus changing the values displaying in your dashboard.
This is the exact type of scenario that can be avoided with data observability. In this article, you’ll learn how to implement data observability elements to detect potential problems, maintain your data lineage, monitor your usage, verify your data freshness, and implement tests to reduce data downtime incidents.
What is Data Observability?
Data observability is an umbrella term for technologies and processes that help to track the health of enterprise data and the overall state of the data in your system. The focus of data observability is to help you prevent data downtime by identifying, resolving, and preventing data related issues immediately.
Data observability give you a 360-degree view of your data ecosystem and uses automation to provide monitoring, change detection, and data lineage to alert you of anything that could be considered a problem so your marketing and business teams can have the visibility to operate more efficiently and effectively.
Data observability seeks to take the best practices from learned in DevOps and DataOps and apply those same learnings to the data world. Data observability aims to provide real-time insights into your overall data flow from external data sources and showcase how it’s being consumed in your downstream applications.
Why Does Data Observability Matter?
One of the main reasons for the need for data observability across your customer data platform is the impact of data downtime. Data downtime is when data changes into a state that is shouldn’t. It could be missing or inaccurate data. The longer it takes to detect something is wrong (if it even gets detected), the bigger the impact it can have.
The impact could start with the time it takes your team to identify and diagnose why the problem happened. But it could move to the business stakeholders and wrong decisions made due to incorrect data. And could even impact your customer. If you are activating your customer data through your CDP to power personalized marketing campaigns and business applications and the data you’re sending is wrong, you could be sending critical business email to the wrong audience.
The longer it takes to detect the data issue, the more likely it will impact your business goals. Which of course, is why data observablity is vital to reduce downtime. It must be stated that data observability isn’t bulletproof, but it’s a lot better than not trying at all.
The Elements of Data Observability
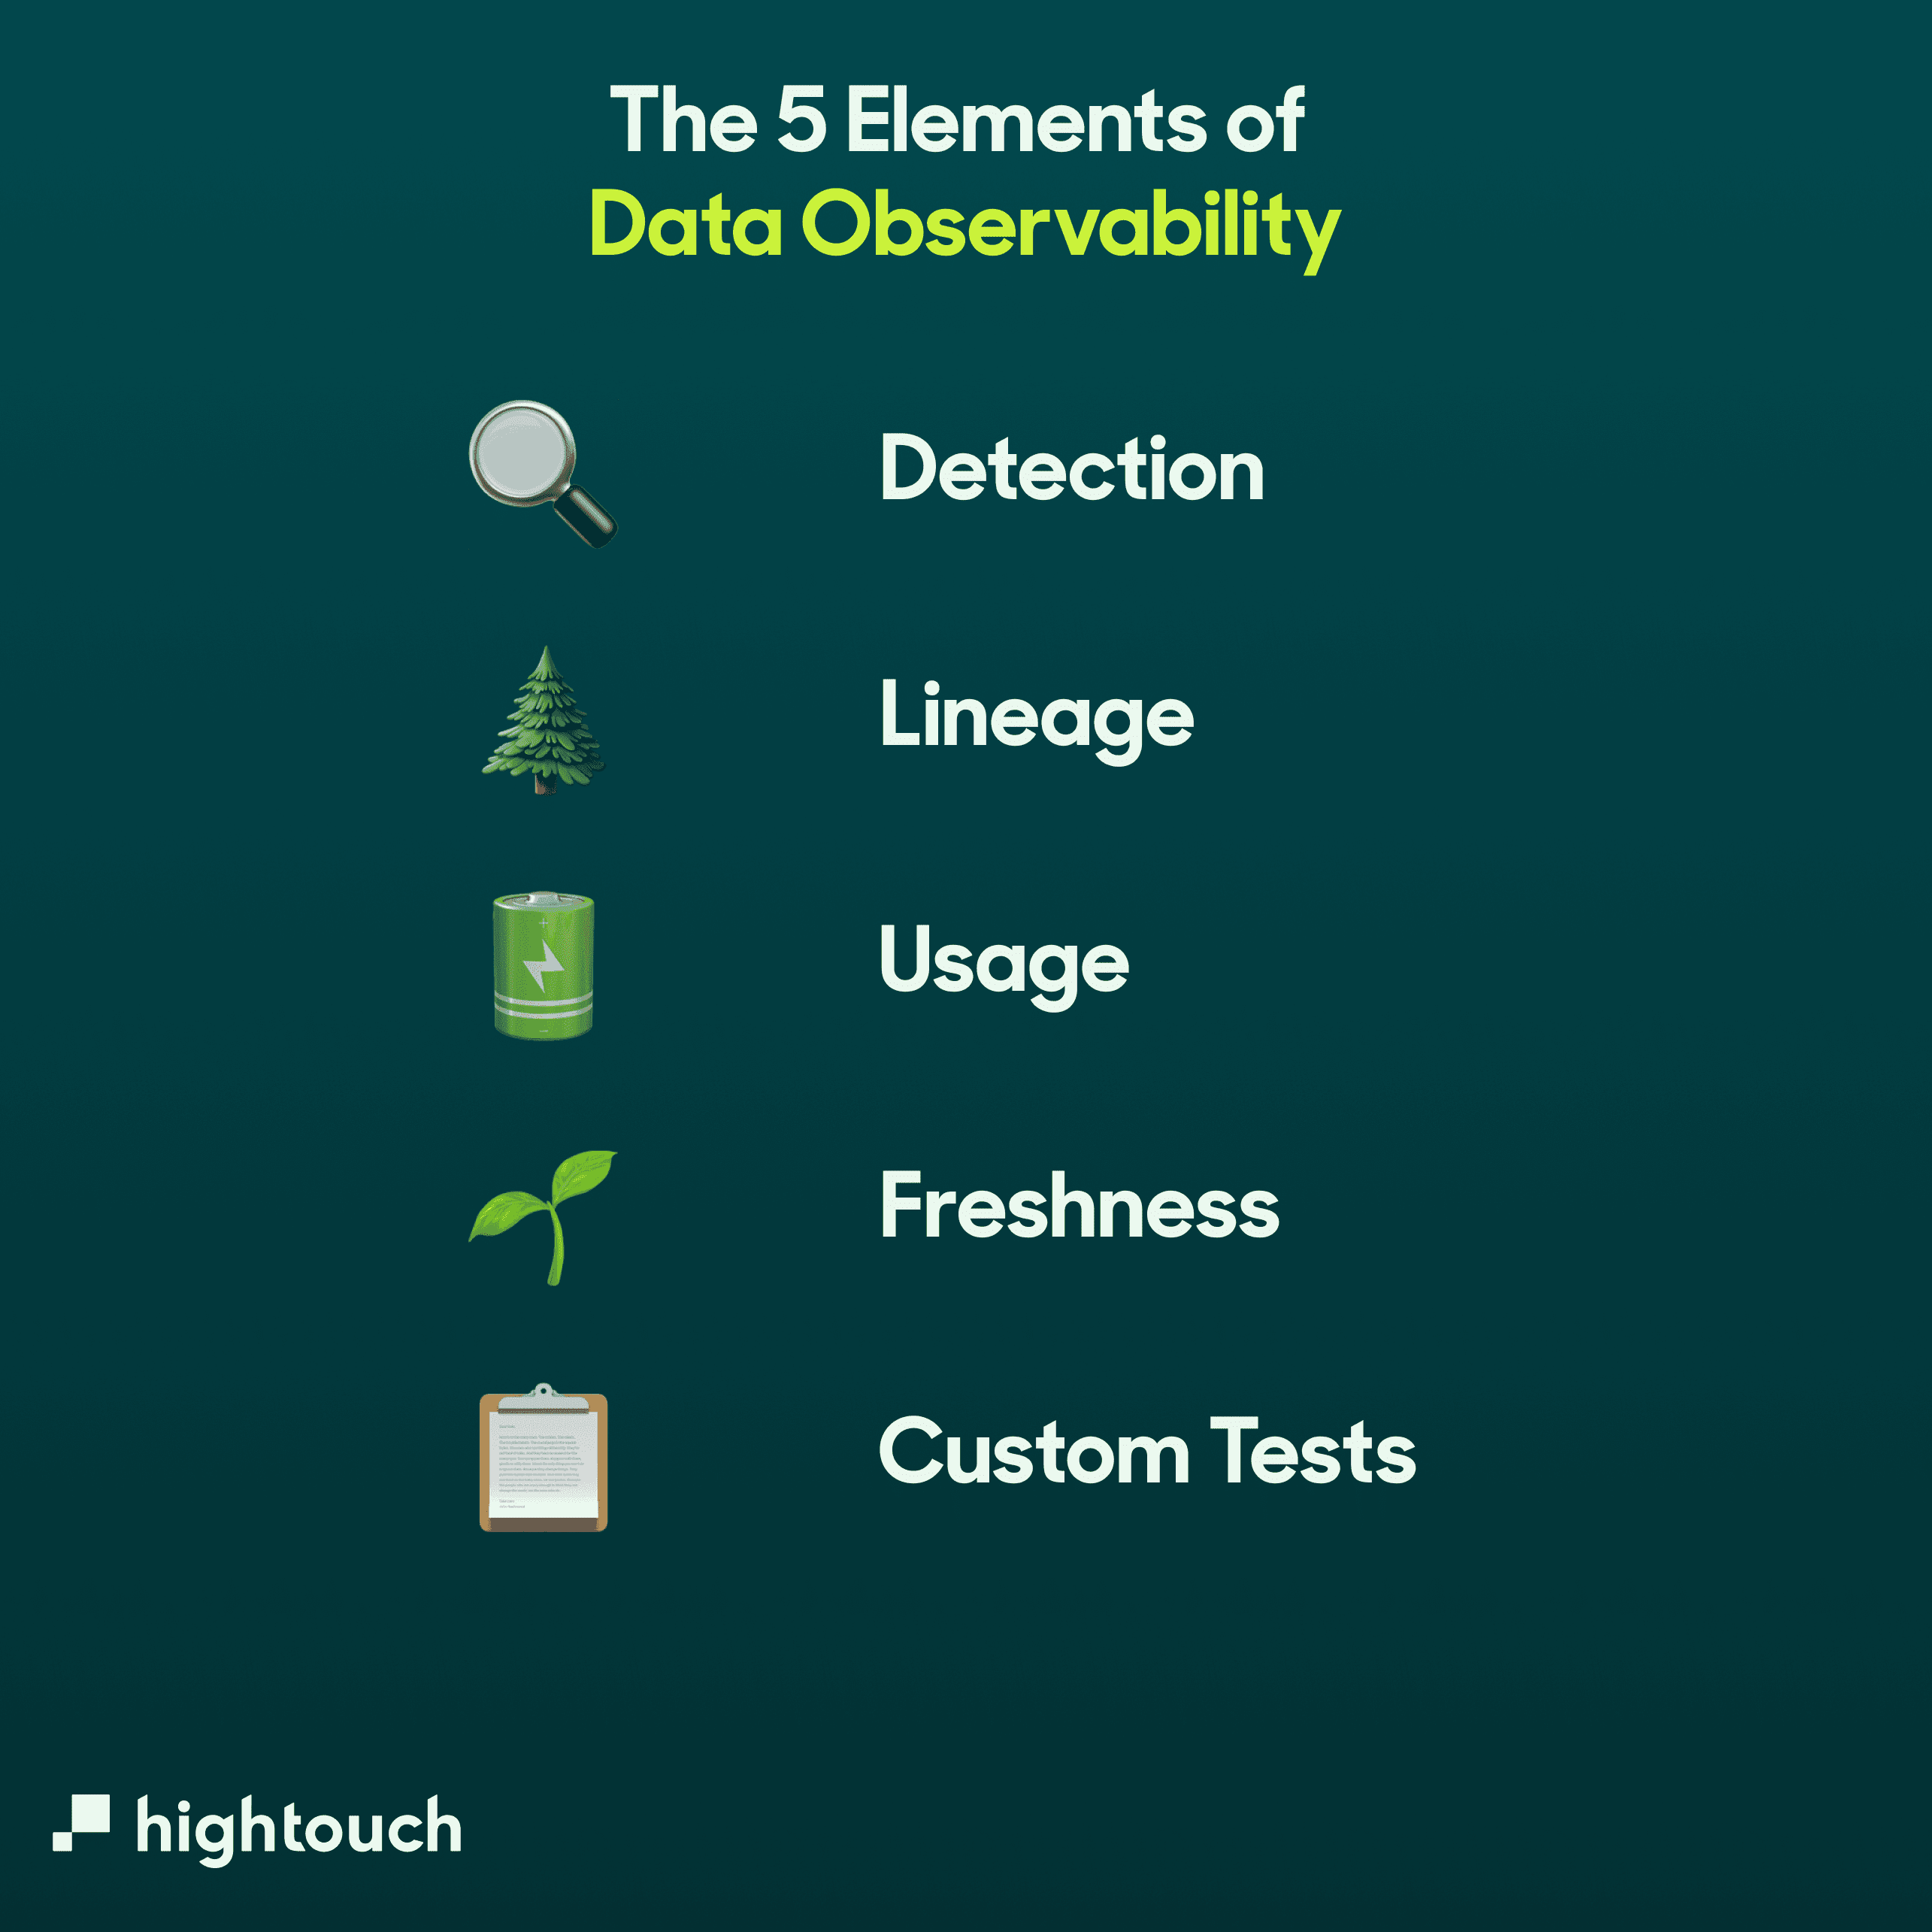
Data observability is a relatively new practice, so with the technological advancement of the modern data stack, the elements of data observability aren’t set in stone and can change. However, some base elements of data observability won’t change due to their importance in creating reliable and quality data.
Detection
Detection is a key part of data observability. It helps you catch any potential issues before they arrive. Detection can notify you of anything outside of normal trends. This could be a value that has suddenly doubled in size. Or more nulls or distinct values than usual. It can also help detect changes to the duration of jobs that run, such as if a job that moves data from A to B usually takes 20 mins and suddenly takes over an hour.
Detection allows you to reduce the time firefighting as you deal with the issue rather than letting it burn.
Lineage
Lineage helps you understand the life cycle of your data. It can show you where data came from and where it’s being consumed. This is very important for data observability. Would you remember what tables pulled the data to a dashboard created 12 months ago? What happens if you need to change some of the data models? Is it a case of finger-crossing, hoping something doesn’t go wrong?
Lineage is the perfect tool to help. You can see exactly what tables are being used where. You can see if a certain table is being used in a dashboard in Looker or what data is being sent to a certain downstream tool. Some data observability tools can show you what would happen if you removed or altered a table. For example, if you had a new way to calculate a lead score, you could see what impact this would have downstream if you changed the formula.
Usage
Seeing the usage can help you reduce the time spent maintaining specific tables. You’ll be able to see how many queries are hitting a particular table. If you find that certain tables are receiving zero or low amounts, you can consider eliminating them, allowing you to focus more on meaningful tables for the business.
Freshness
Data observability can highlight when certain tables have been updated. If a table should be updated every hour, but for some reason, it’s been over seven hours, you can be alerted to this situation and look into why.
Custom Tests
Most data observability tools come with automatic testing, which can help with situations described in the detection element above. But there may be certain situations where you need more specific testing, which requires certain business logic.
For example, if you’re capturing revenue data, you would need a custom test that alerts you if that field is null or zero. There should always be a positive value in that field, so if it doesn’t, you need to be made aware to investigate what might have gone wrong. Data observability gives you the option to create custom tests so you can be alerted to situations that might be unique to your data.
Data Observability Use Cases
To help you understand further the benefit that data observability can offer, here are some use cases showing how important it can be in real-life situations.
Monitoring
Say, for example, you have five different deal types in your business, and each deal requires to have one.
Without you knowing, the engineering team has created three new deal types. With a data observability tool, you can get alerted when one of these new deal types comes through, highlighting something is wrong. Without a data observability solution, you would have no idea this happened, and these new deal types could be excluded from any data analysis.
Testing
Data observability tools come with their own testing and allow custom testing. These tests can be set up to notify you if anything changes out of the normal data trends or the accepted ranges of that you set for certain values.
For example, if you capture the value of a deal, you know that this can’t be zero or below, you can set up testing to ensure if it does drop below zero, you can be alerted to investigate.
Quality
Data observability helps ensure your receiving data is of as high quality as possible which is needed if your company relies on it to make critical business decisions. If you have missing values, you could leave out data that can skew your results. If, for example, you were capturing user behavior, but the user ID hasn’t been sent over, this could leave out data that isn’t being pulled into any dashboards or reports.
Reliability
You want the data you receive to be reliable. Most of the time, if a pipeline has been set up, there shouldn’t be much of a change over time. If, for some reason, a column is removed or added though, you want to know about it immediately so you can investigate why it’s happened and fix it if it’s a problem.
Data Observability Tools
There are a few options for data observability platform that you can use, but there are three main leaders.
Metaplane
Metaplane allows you to add observability to every part of your tech stack, from your data warehouse to your transformation tools and BI platforms. Metaplane is designed to help users monitor and analyze their data systems in real-time to ensure they are running smoothly and producing accurate results. One of the main features of Metaplane is how easy it is to implement and set up new tests. Due to a user-friendly interface, new tests can be set up with a single click. It can assist you with the following:
- Monitoring and anomaly detection
- Schema changes
- Usage analytics
- Lineage and impact analysis
- Data CI/CD
- Job monitoring
Monte Carlo
Monte Carlo is the data observability tool that is currently trusted by CNN, Fox, Intercom, and many others. The company's goal is to help increase trust in data and reduce data downtime by detecting freshness, volume, distribution, schema, and data lineage. Some of the features that they have to help with data observability are:
- Set up in 20 minutes and complete field lineage mapping within 24 hours
- Machine learning enabled data anomaly detection and targeted alerting
- Data lineage to assess the impact and fix root causes
- Helps reduce infrastructure costs by identifying high consumption and deteriorating queries
Datafold
Datafold is taking an unique approach to data observablity where is can help you observe code changes can impact the data, so rather than finding out about the data quality issues when it happens, Datafold can show you before there is an issue. One of the key features of Datafold is through data diffing. Data diffing is where it can identify if any changes will alter any values. These changes may not be something that causes a direct problem but might be something you should look into.
Some other features Datafold features are:
- Integrates with dbt Cloud and Core
- Produces impact reports before any deployments to avoid any surprises
- Easy to use UI
- View how changes can impact downstream data applications
Final Thoughts
If you want more confidence in your data products, then a data observability solution is key to capturing any problems that can arise with data. Currently, data observability has a focus on being reactive, letting you know as soon as a problem has occurred.
The future of data observability is working on getting deeper into the data lifecycle, moving from being reactive to proactive. This means you’d get alerts of data problems before they make it to your data warehouse. With more companies using a tool like Hightouch to activate their data, you’d be able to prevent sending poor data quality to your downstream tools, without impacting your customer.