There are so many moving pieces to assess the performance of your B2B SaaS business and assessing performance. You have your sales metrics, marketing metrics, product adoption: the list goes on. But fundamentally, there are only a few key metrics that matter in terms of understanding the health and areas of improvement within your business.
As a data-driven B2B SaaS company ourselves, we put together this list of top B2B SaaS metrics used widely in the industry as well as some sample formulas and step-by-step guidance on how to calculate each one.
What is a B2B SaaS Metric?
B2B SaaS metrics are a set of key performance indicators (KPIs) you can track within your business. They help you measure business growth, identify areas that aren’t working, and track the impact of any changes you make.
Seven key metrics you need to measure in your B2B SaaS
Ultimately, every B2B SaaS will track a slightly different set of metrics and KPIs. Here are the top ones you can implement immediately to level up your business.
Lifetime Value
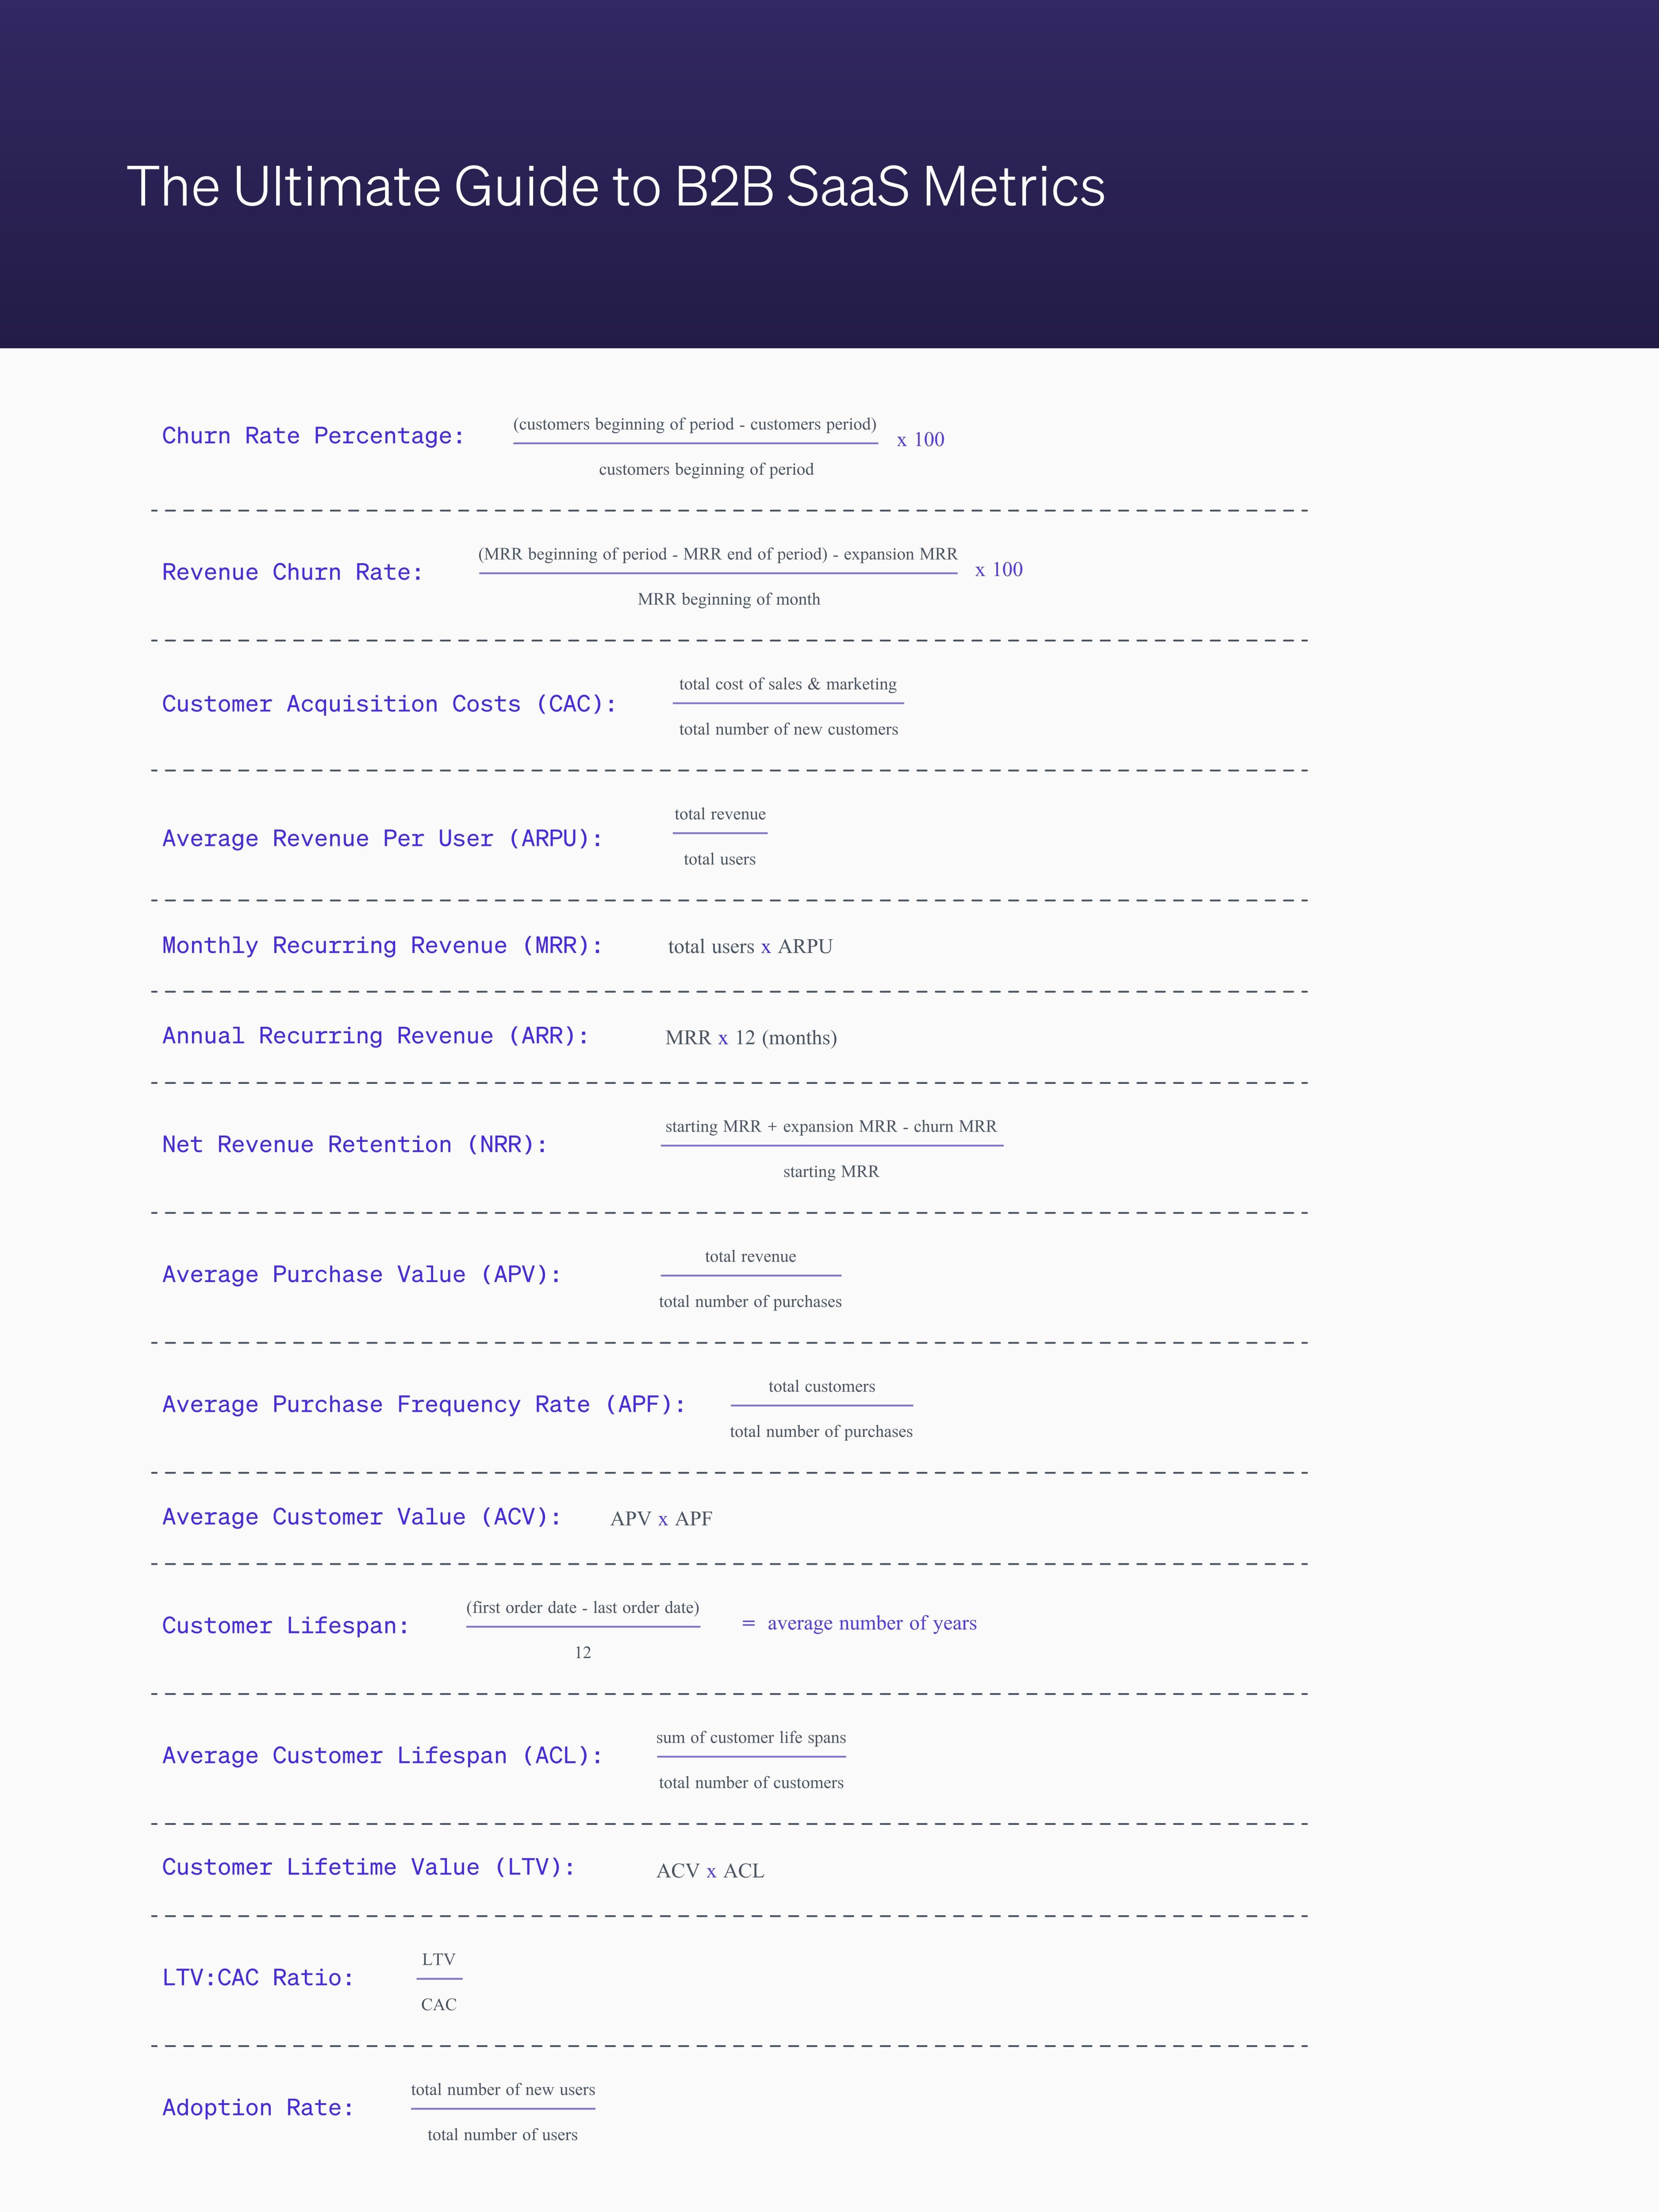
Lifetime value (LTV) is the total revenue you can expect from a customer or account during the entirety of your business relationship. LTV takes the current revenue from a given customer or account and compares it against the predicted lifespan. A longer lifespan means a higher LTV.
Before you can calculate LTV, you first need the following metrics:
- Average purchase value (ACV)
- Average purchase frequency rate (APFR)
- Average customer value (ACV)
- Average customer lifespan (ACL)
- Customer acquisition costs (CAC)
If you have all the above, you can calculate your LTV value by taking your average customer value and multiplying it by your average customer lifespan.

Most B2B SaaS companies calculate LTV as a critical data point. It lets you know how well your company is doing, allowing you to forecast and predict costs.
Knowing your LTV will help you calculate your growth rate and enable you to measure your return on investment (ROI) against your customer acquisition costs (CAC) so you can understand precisely how long it takes to break even.
You can learn how to calculate LTV in SQL in our How to Calculate LTV (Lifetime Value) in SQL article.
Marketing Qualified Lead
An MQL is a way for your marketing team to highlight customers that align with your ideal customer profile (ICP). At its core, an MQL is a qualified lead that has interacted with your brand, whether signing up for a free trial, viewing a specific page, or adding an item to the cart. Ultimately an MQL is a qualified lead that has shown signs of becoming a paying customer.
To calculate an MQL, you need to define all events a lead could do that indicate their interest (e.g., downloading a whitepaper, signing up for a webinar, viewing your pricing page, etc.) Once you’ve defined these basic actions, you’ll need to assign a numerical score for each so you can begin classifying leads as MQLs using a weighted average.
Without a proper MQL definition, your marketing department is just surfing through a sea of unqualified prospects that look identical. MQLs help your marketing and sales teams collaborate effectively so they can focus on what matters most - converting those qualified opportunities into deals. Once you tag a prospect as an MQL, your marketing and sales teams can prioritize them and work to book meetings with these prospects and transition them to sales qualified leads.
You can learn how to calculate MQLs in SQL in our How to Calculate MQL (Marketing Qualified Lead) in SQL article.
Sales Qualified Lead
Sales qualified leads (SQLs) are customers with significant intent to buy. These are customers that have expressed interest in purchasing your products or services. In almost every scenario, all SQLs originate from MQLs or product qualified leads (PQLs.)
For most B2B SaaS companies, SQLs are flagged only after the first meeting has been booked. Then you can attribute points for positive actions such as sitting through a demo call or signing up for a free trial. SQLs help your sales team prioritize the right leads and personalize their outreach based on the unique actions that your customers are taking in the sales process.
You can learn how to calculate Sales Qualified Leads in SQL in our How to Calculate SQL (Sales Qualified Leads) in SQL article.
Monthly Recurring Revenue
Monthly Recurring Revenue (MRR) is a metric to track the recurring monthly revenue you generate in a given month. Net New MMR, Downgrade MRR, and Churn MRR are just a few of the different types of MRR that you can calculate. Knowing which ones you want to measure can help you make the best data-informed decisions.
To calculate MRR, you need to know your average revenue per user. You can work this out by dividing your total revenue by your total number of users.
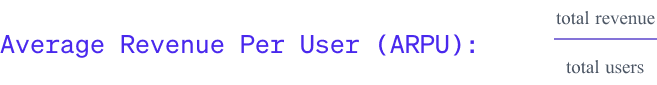
Once you have your ARPU, you multiply that by your total number of users to get your MRR.

MRR is important because it allows you to measure a B2B SaaS’s monthly performance to identify precisely what actions positively or negatively impact your revenue. Knowing your MRR helps you be proactive rather than reactive. You’re able to make a direct correlation between your customer’s spending data and your existing accounts. For example, maybe a bug in your app caused a small percentage of your customers to churn, thus translating to a lower MRR. Without MRR doing this type of analysis is impossible.
You can learn how to calculate MRR in SQL in our How to Calculate MRR (Monthly Recurring Revenue) in SQL article.
Annual Recurring Revenue
Annual recurring revenue (ARR) is a measurement showing your yearly revenue. You can calculate it on an account/customer level or even for a specific subset of those groups. ARR is an annualized version of MRR.
Calculating your ARR is as simple as multiplying your MRR by 12.

Knowing your ARR enables you to track the health of your revenue. It’s also helpful for measuring ROI because you can compare customer acquisition against your ARR to see where you break even.
ARR also allows you to identify trends with your highest and lowest value customers. Maybe there’s a specific feature all of your enterprise customers have, or perhaps some of your lowest spending accounts have surpassed their product usage threshold. Either way, when you deeply understand your ARR, you can look for ways to optimize it.
You can learn how to calculate ARR in SQL in our How to Calculate ARR (Annual Recurring Revenue) in SQL article.
Product Qualified Lead
Product-qualified leads (PQLs) are users actively using your product and are most likely to convert to paying customers. PQLs allow you to track user-related behavior to understand where someone is in the buy cycle. By letting users try your product before they buy it, you’re giving the customer immediate value rather than forcing their first interaction to be with a salesperson.
Every business will calculate PQLs differently, but it comes down to two different methods. Either by building a lead scoring system that assigns points to different events (such as last login date, time spent in-app, and active users), or you can make things simple and define specific actions instead.
Once you have decided on the point allocation for each event or action, you can total them up, and when they reach a certain score, they are tagged as a PQL. It’s likely you have the data to calculate PQL in your data warehouse so you use SQL to calculate it easily.
PQLs are great for seeing how customers use your product and which are more likely to become paying customers. Unlike SQLs and MQLs, which can be biased due to the marketing team defining the criteria, PQLs are based on customer actions within your product, so they are more accurate.
Lead Score
One of the best ways to help your sales teams surface through leads is to leverage a lead score. Lead scoring looks at three different types of data, behavioral, demographic, and historical. The premise behind lead scoring is to prioritize your leads based on how closely they align with your ideal customer profile.
There’s no single way to calculate a lead score. You’ll need to define what events or attributes you want to measure and then apply a numerical value to each. For example, if you’re using a ten-point scale, you could assign one point to all leads who fall in a relevant industry or two points to leads who have viewed your pricing page.
The first step to implementing lead scoring is centralizing all the necessary data components of the score into a single source of truth (such as your data warehouse). Then you can use SQL to calculate it.
Lead scoring helps your sales team prioritize the right leads in real-time based on their unique actions in your product and the key attributes that make up their profile. Lead scoring also has huge implications for marketing because you can enroll specific prospects in campaigns designed to qualify them further and increase their lead score.
Churn Rate
Churn rate is the percentage of customers that stop using your services. It could be voluntary where they no longer have a use of your product or the customer experience isn't positive. Or it could be involuntary because of expired card details.
You calculate customer churn rate by first deciding the period of time you want to calculate across, for example, over a month. Then you take the number of current customers who canceled and divide it by the number of customers you had at the beginning of the period. Then multiply it by 100 to get a percentage.

You can also work out the revenue churn rate, which calculates the revenue difference over time as a percentage. To work this out, you decide on a set time period, usually a month. So for this, you take the MMR at the beginning of the month and subtract the MRR at the end of the month. You then subtract any expansion revenue (any customer upgrades) and divide this number by the MRR at the beginning of the month. To get a percentage, you simply multiply by 100.

Knowing your churn rate can give you a good indication of how satisfied your customers are and how sticky your product is. And gives you an overall view of how well your business is performing. If this is not where it needs to be, you can focus on efforts like customer success, improving your product onboarding and activation, etc
Conclusion
Measuring some or all of these metrics can positively impact your B2B SaaS company. You’ll be able to forecast how well your business is doing using LTV. Your sales team can focus their efforts with clearer insights into their customers and which ones are more likely to convert into paying customers. And you’ll be able to see what changes in your business affect performance by looking at metrics such as ARR, MRR, and churn rate.