As a business, it’s valuable to know the impact of decisions on various business processes. Without any insights on performance, how can you know if something is working or not and needs to be stopped?
That’s why data analysis is so important. It makes sense of the various data sources and produces insights that can inform decision-making.
The data analysis process has five steps. Without these, you would be swimming in a sea of data with no way of navigating to reach a valid conclusion.
This article will walk you through the five steps involved in data analysis process. Before we get into that, let's understand further why data analysis is so critical.
Why is Data Analysis so Important?
Making decisions in business can be difficult. Sometimes it can be led by opinions or simply gut feeling. You could end up being lucky and hitting the jackpot every time, but eventually, a decision you make might not produce the outcome you want and could be an expensive mistake.
To help give you clarity on your decisions and to help guide you to the right decisions within your business, data analysis is used. It takes the guesswork out of making big decisions that could negatively impact your business and allows for data-driven decisions.
Data analysis takes the data you already have and lets you easily see how decisions impact your business. It gives you a rod to steer the ship in the right direction by using facts you have gathered and presenting them in a meaningful way. This then can lead to making a decision that is backed by facts and not a fuzzy feeling you may have or rolling a dice and crossing your fingers it was the right decision to make.
The Steps for Data Analysis
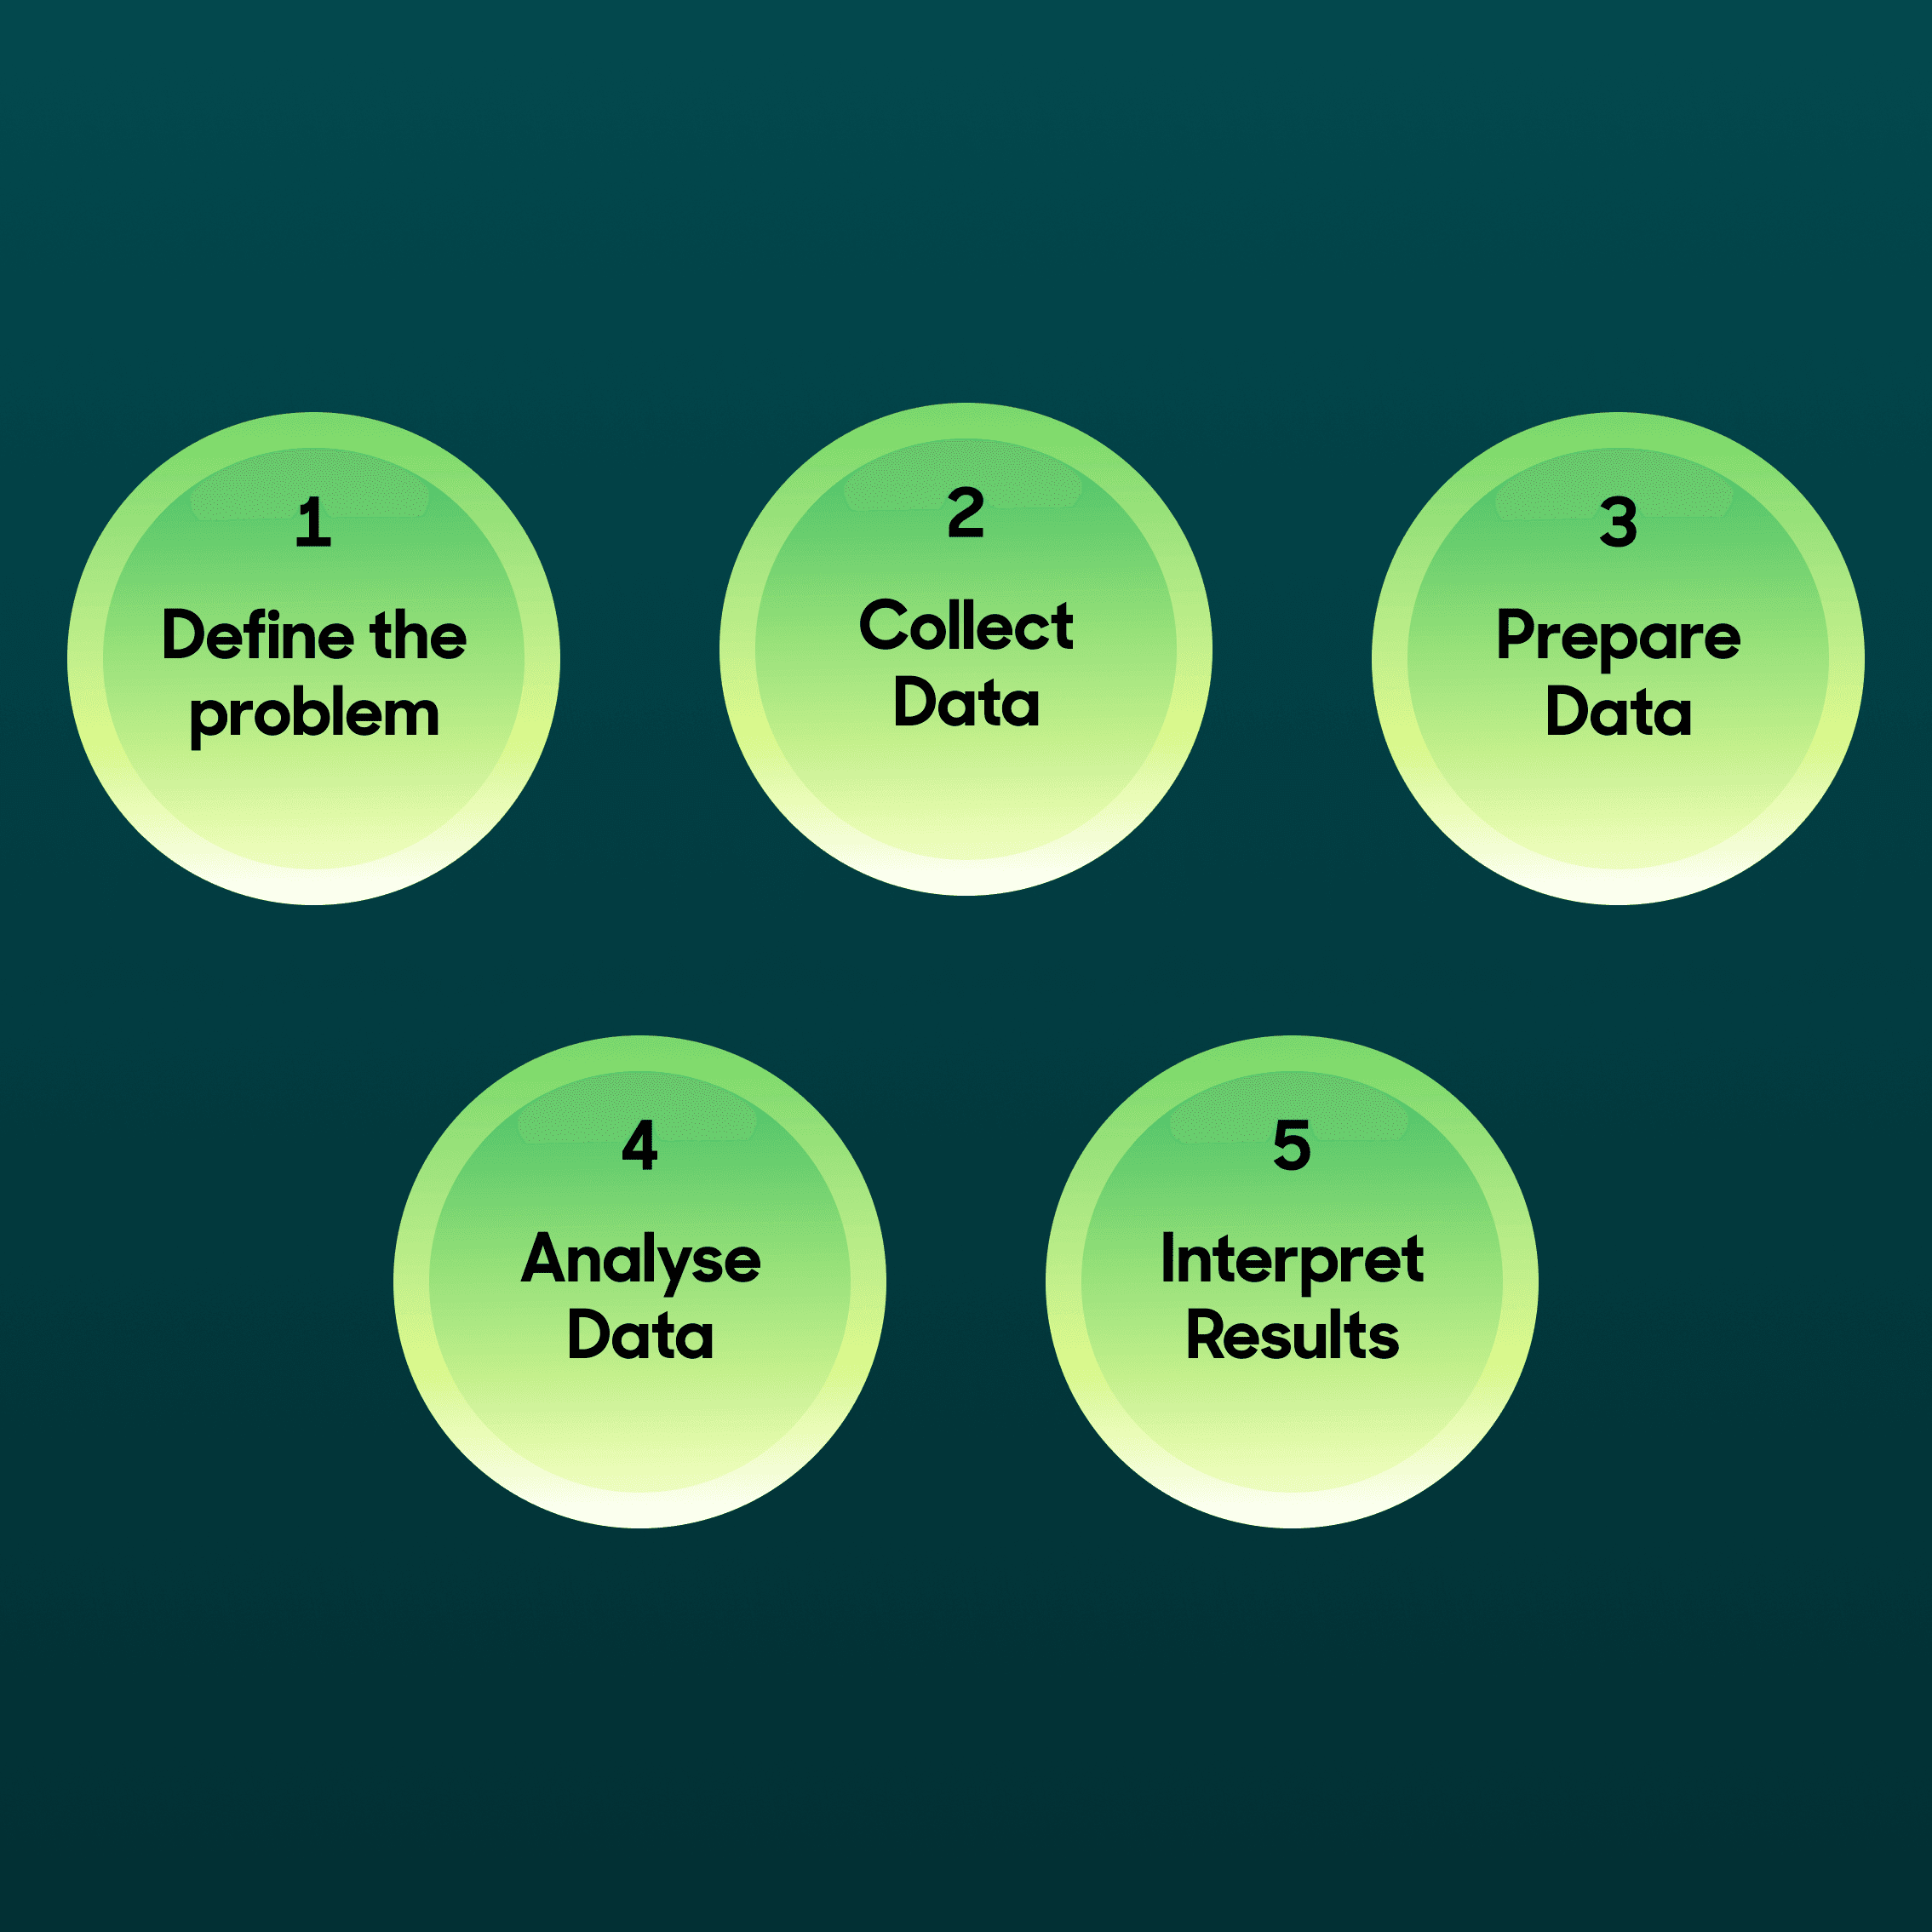
Step 1: Define the Problem and Research Question
It can be easy to jump straight into collecting the data you need and creating dashboards to try and answer every question thinking this will be helpful for everyone. But if it’s not driving business value, the work done is useless.
The better way of conducting data analysis is starting with a business process, such as dealing with customer retention and asking a question that can reveal helpful insights. Taking the retention example, a question could be, “What retention methods have worked the best?”
This way, you can identify the data that needs to be collected to get the answers the business objective.
Another example of the type of question that data analysis would be useful for would be “Is influencer marketing as effective as Facebook ads?”
These questions can be derived from two different scenarios. As a data analyst, you know you have rich data from a certain source, such as Facebook ads, and know that if you look deeper, it could produce valuable insights for the business.
Or you could be working alongside a department in the business, such as marketing or sales, and they want to know if something they’re doing, such as a cold outreach experiment, is performing well or not.
Once you have an idea of the problem that needs insights and boil it down to a question, you can ensure the correct data is collected to answer the question.
Step 2: Collecting Data
Once you understand the question you need to provide insights for, it’s time to gather the necessary data. There are different types of data that you can collect.
-
First-Party Data: First-party data is collected from your customers and audiences on channels like your website or app. You can gain insights about demographics, purchase history, website activity, email engagement, sales interactions, support calls, customer feedback programs, interests, and behaviors.
-
Second-Party Data: Second-party data refers to information shared by one organization with another, often as part of a partnership. This data is typically collected and owned by the first organization and shared with the second organization to enhance their insights and create value.
-
Third-Party Data: Third-party data is owned and sold by a separate organization or individual and is often compiled from numerous sources. It can include demographic details, online behavior, purchase history, and more. Third-party data is often collected through cookies, tracking pixels, and other tracking technologies and is then shared or sold to other organizations for various purposes.
Consolidating all this data from various sources means having a single source of truth for your data.
Typically this data is collected and stored in a data warehouse where it can be easily accessed in a single place and has the computing power and storage capacity needed. You could use a tool like Fivetran or build your own data pipeline using Python scripts to send data from data sources into the data warehouse.
Step 3: Preparing Customer Data
Now you have the data you need, it’s time to transform it into a useful state.
You may be fortunate and have the data going into the data warehouse being modeled with a tool such as dbt. If that’s not the case, the data warehouse may contain only raw data, meaning you would have to clean and model the data to get it into a useful state.
When dealing with raw data, you need to clean it up, so it’s accurate and useful. Some of the processes involved in cleaning the data could be:
- Removing any errors or duplicate values
- Filling in any missing data
- Structuring the data so it can be manipulated more easier
- Removing any data that isn’t relevant to the analysis you are performing
These steps in the data analysis process can be one of the most time-consuming. You want to ensure that the data you will be working on is as accurate as possible, as any errors can impact your results.
Step 4: Analysing the Data
Now that you have data to work with that is relevant to the task you have at hand and are confident that it’s accurate, it’s time to analyze the data.
There are a few different analysis techniques. Descriptive and diagnostic are useful for taking data from the past and looking at the effectiveness of what a business is doing or why something might not have reached the business outcome that was set out to achieve. Predictive and prescriptive are looking into the future and gaining insights that can be used for experimentation.
-
Descriptive Analysis: Descriptive analytics involves looking at past events and patterns. It is often the first step in data analysis before delving deeper into a subject. For example, a company might use descriptive analytics to determine the number of users who accessed their product during a certain time period or to measure sales figures from the past couple of years. Although concrete decisions may not be made based on these insights alone, compiling and presenting the data can help the company understand how to move forward.
-
Diagnostic Analysis: Diagnostic analytics is a type of analytics aiming to understand a problem’s root cause. Instead of just describing what has happened, it involves identifying the factors that may be contributing to the issue. For example, a company might use diagnostic analysis to identify the factors negatively impacting the customer experience. This could involve examining the relationship between various factors, such as delivery speed, project expenses, and the main problem. Diagnostic analysis can help a company pinpoint the specific issues that need to be addressed to improve their operations or customer satisfaction.
-
Predictive Analysis: Predictive analytics is a type of data analysis that uses historical data to forecast future trends and growth. It has become increasingly advanced with the development of technology. For example, insurance companies often use past records to predict which clients are likely to be involved in accidents and adjust their insurance premiums accordingly.
-
Prescriptive Analysis: Prescriptive analytics is a type of data analysis that enables users to make recommendations for future actions. It is the final step in the analytics process and considers all previously analyzed aspects, presenting multiple options and the potential consequences of each. For example, a company might use prescriptive analytics to minimize patient appointments and care uncertainty. This analysis helps the organization determine the best times for scheduling check-ups and treatments to avoid negatively impacting patients and ensure their health and safety.
Step 5: Interpret the Results
Up to this point, we know what answers we are looking for in the data by clarifying research questions. We‘ve collected, cleansed, and modeled the data, so we know that we have accurate and useful data. Now it’s time to interpret the results.
This involves presenting the data. Typically this would be presented in a BI tool such as Looker and Tableau and includes a breakdown of some of the outcomes from the insights in the data. It’s important to include everything you’ve found so decisions can be made from the entirety of the data you’ve found.
It is also important to share any gaps in your data or any data you had to interpret due to poor quality or missing data.
The dashboard that you create could be static, where it takes the data that has been collected and presents the insights. Or if you have the processes, the data is continuously updated using a tool like Fivetran, where you can set a schedule where it pulls data from the various data sources and set a schedule for when it gets pulled into the data warehouse. The dashboard can continuously update, so data is as fresh as the schedule is set.
With the data analysis complete, the business process management can take action and make a decision.
Going Beyond Data Analysis: Data Activation
But it doesn’t have to stop there. It’s common to find that once a dashboard is created, it may get looked at maybe once but sometimes never! Even if it is sometimes looked at, it can be hard to turn the insights into action.
Which is where data activation comes in place. Now that all your data is in the data warehouse, you’re in the perfect position to take action. Hightouch can assist you in syncing data from your data warehouse to your business’s downstream tools. So when you discover something valuable from a dashboard, rather than it being forgotten about, Hightouch can send any data that can assist in taking action directly to the tools that team the various departments work within.