Campaign Intelligence is available as an add-on on Business tier plans.
Overview
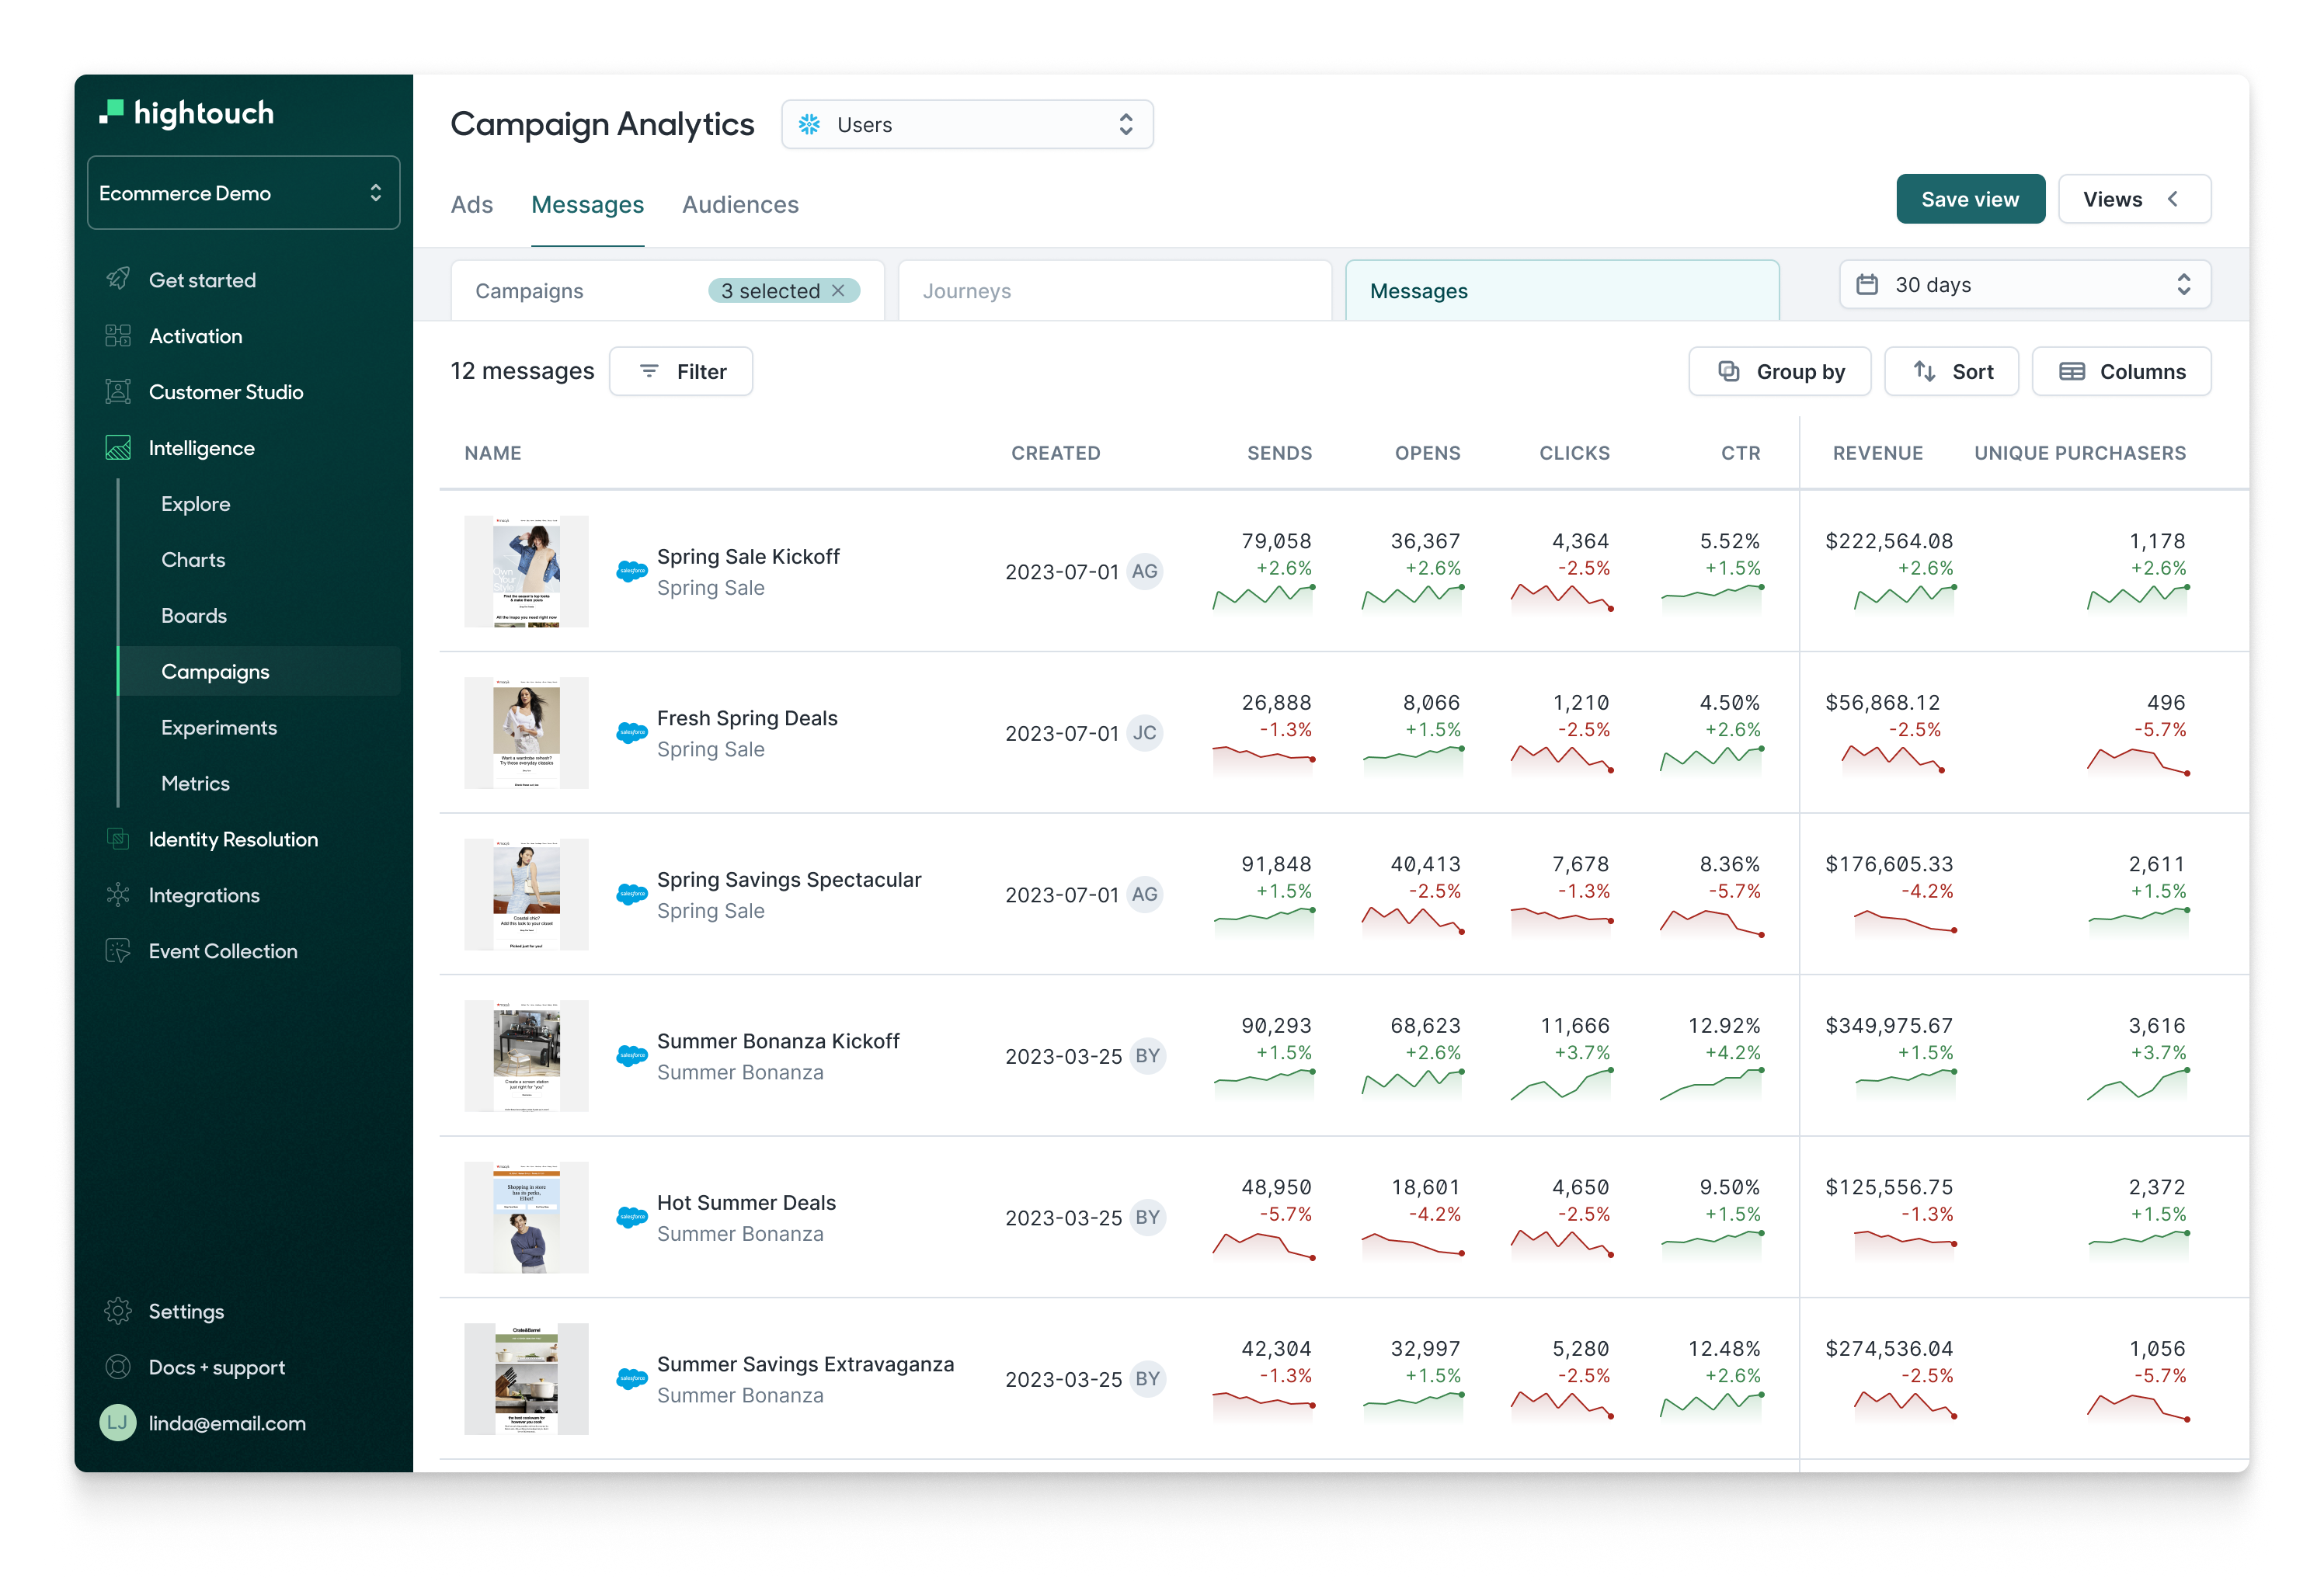
The messages dashboard is the best way to view performance for all your email, SMS, push, and in-app messages. You can build reports for campaigns, journeys, or individual messages using engagement metrics like sends, opens, and clicks along with custom conversion metrics such as transactions.
Configuring Your View
To configure your view, follow these steps to select the appropriate columns:
1. Select Columns
-
Asset Columns
Asset columns describe the asset and include attributes such as the created date, author, status, variant, campaign type. These columns are sourced from the asset model in the schema layer.
-
Engagement Metrics
Engagement metrics typically include sends, opens, clicks, and click through rate (CTR), but this can vary by channel (for example, SMS has no opens). These events are typically generated from channel tools such as Iterable, Braze, SFMC, Klaviyo, and Attentive and loaded into the warehouse. These metrics are pre-defined based on the interaction type selected.
-
Conversion Metrics
Conversion metrics are based on metrics defined in the metrics layer and use the attribution model defined in the attribution layer. Common conversion metrics include the number of transactions, total revenue, unique user transactions, bookings, and product views. These metrics can be derived from any customer event, both online and offline.
2. Apply Filters
Filters enable you to customize the view to see only the campaigns or ads that are relevant. You can filter on any of the columns defined above. Common filters include filtering by campaign name, campaign dates, or spend amounts. You can apply string-based filters or numeric filters.
3. Time Range
We have four default time ranges: 7 days, 14 days, 30 days, and 90 days.
Note: The time range is not to be confused with the attribution lookback window. The time range only determines which conversions to report in the UI, whereas the lookback window in the attribution model determines which touchpoints should be attributed for a conversion.
4. Column Sorting
You can customize your view by sorting your columns either alphabetically or numerically. You can sort in ascending or descending order.
Saving Your View (Coming Soon)
This feature is in development and will be live in August 2024.
You will be able to name and save your view to be revisited and shared across your team.
Creative Drilldown (Coming Soon)
This feature is in development and will be live in September 2024.
Additional documentation is coming soon, please if you're interested in this feature.